
Working capital measures your immediate operational runway (current assets minus current liabilities), while cash flow tracks the dynamic movement of money through your bank. This guide breaks down the critical differences between balance sheet strength and cash velocity. You will gain actionable cash-conversion cycle strategies to unlock trapped capital and maintain complete corporate solvency.
You check your corporate dashboard and see record-breaking sales. Your sales graph points straight up. Your income statement shows soaring net profits. You celebrate.
Yet, three weeks later, you panic when checking your bank account. Your suppliers demand immediate payment, while your customer invoices sit unpaid in ninety-day billing queues. This silent squeeze represents the exact point where paper profits collide with cold, hard reality. To survive this pressure, you must master the daily relationship between working capital and cash flow.
Many executives treat paper assets as spendable money. This mistake ruins otherwise viable businesses every single day. Understanding the balance between cash flow and working capital preserves your strategic freedom. It keeps your doors open when credit markets freeze. This guide helps you navigate these financial currents with absolute confidence.
What is the core difference between working capital and cash flow?
While related, cash flow and working capital measure distinct dimensions of corporate liquidity:
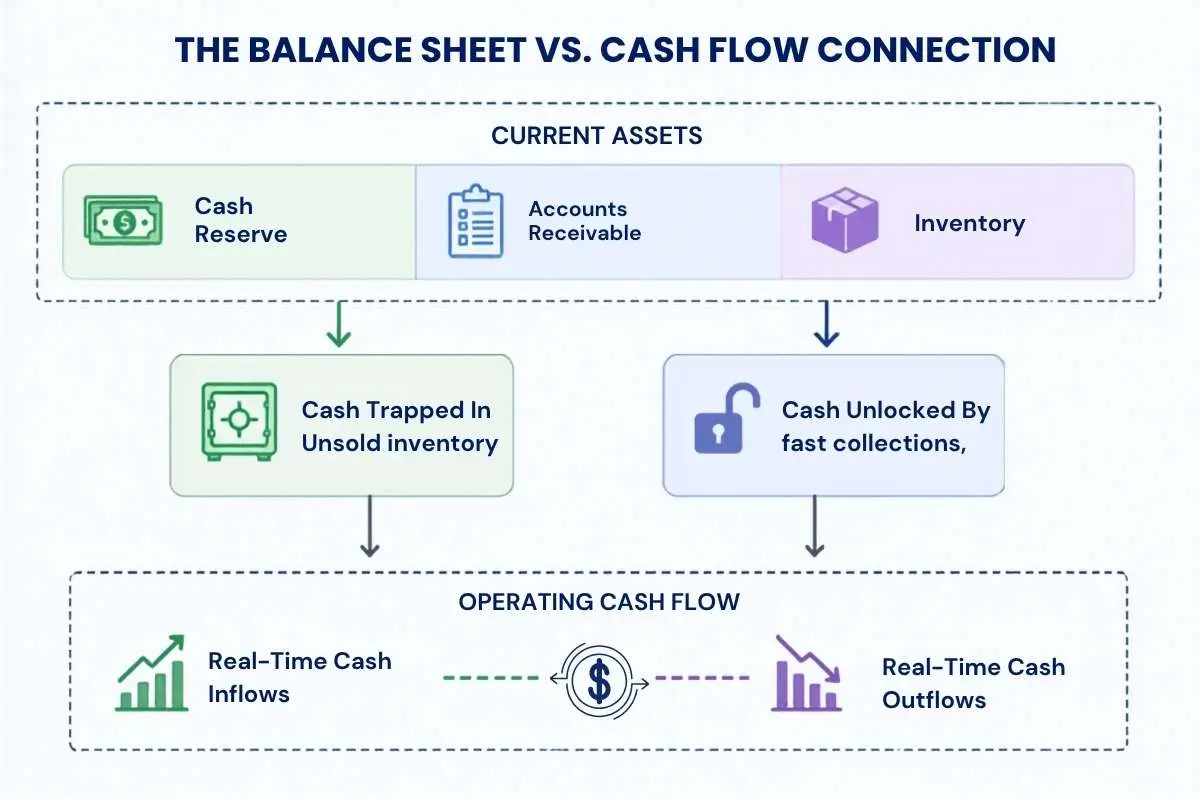
- Working Capital represents a static balance sheet metric. It measures your company’s immediate short-term financial runway, calculated as current assets minus current liabilities.
- Cash Flow represents a dynamic flow statement metric. It tracks the actual movement of cash in and out of your business over a specific reporting period.
Your operational choices directly link these two metrics. If you lock up cash in inventory or unpaid customer bills, your net working capital rises, yet your actual bank balance drops. Conversely, faster customer collections lower your working capital requirements while generating a massive wave of positive operating cash flow.
Why do executive teams confuse balance sheet assets with liquid bank balances?
Many executive teams fail because they view working capital and cash flow as identical metrics. This misunderstanding creates critical planning blind spots.
Working capital provides a single point-in-time snapshot of your balance sheet strength. It proves your ability to pay off upcoming short-term debts using liquid assets coming due within one year.
Cash flow, however, operates like a moving video. It does not concern itself with static assets. Instead, it measures the sheer speed and volume of cash transactions. A company can maintain positive working capital but suffer from negative cash flow if customers take 90 days to settle their invoices while raw material suppliers demand immediate payment.
Where do you locate these metrics on your corporate financial statements?
Evaluating working capital and cash flow requires you to look at different parts of the financial statements.
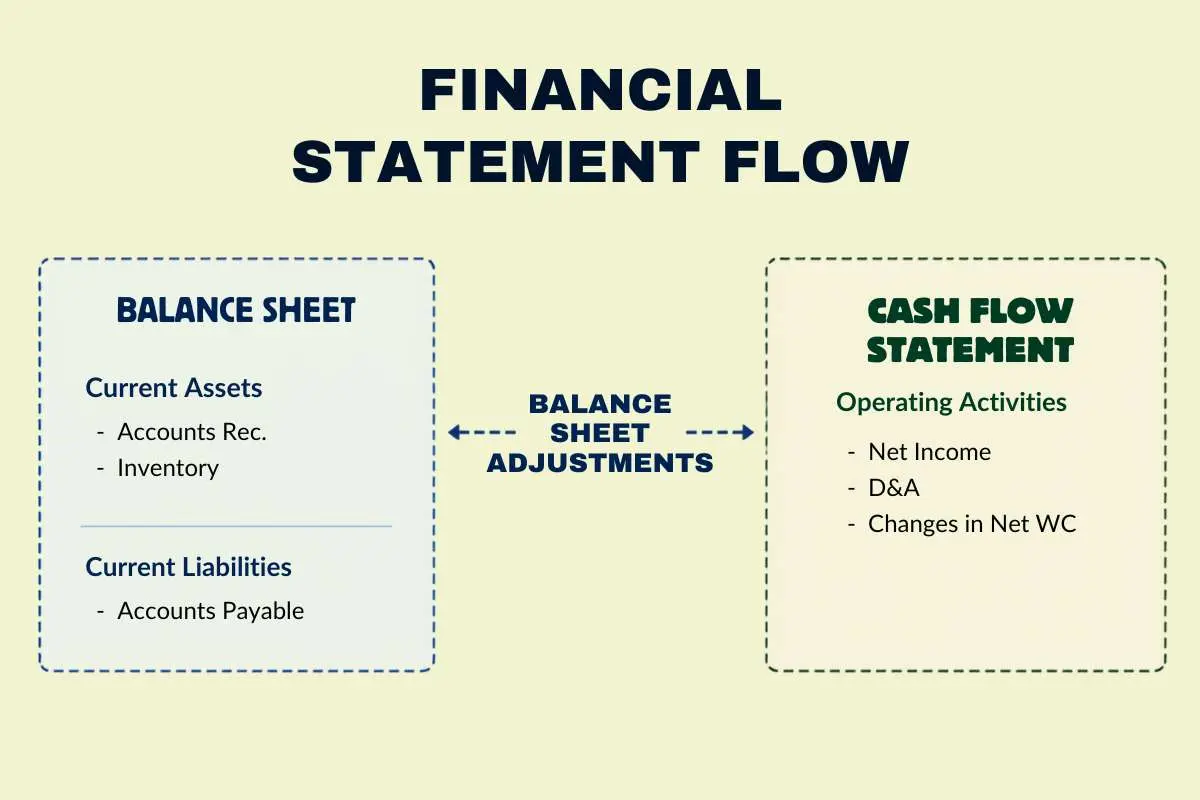
To find working capital, you must navigate to the balance sheet. You locate current assets (cash, accounts receivable, and inventory) and subtract current liabilities (accounts payable and short-term debt).
To find cash flow, you pull the Statement of Cash Flows. This document filters money movement into three distinct sections:
- Operating Activities: The cash your core business transactions generate.
- Investing Activities: The cash spent on capital expenditures, acquisitions, or equipment.
- Financing Activities: The cash moved through debt issuances, repayments, or equity funding.
This comparison chart clarifies how working capital and cash flow diverge across operational horizons:
| Dimension | Working Capital | Cash Flow |
| Financial Statement Source | Balance Sheet | Statement of Cash Flows |
| Measurement Style | Static Snapshot (Point-in-Time) | Dynamic Flow (Over a Period of Time) |
| Basic Formula | $Current Assets – Current Liabilities$ | $Cash Inflows – Cash Outflows$ |
| Component Elements | Inventory, Accounts Receivable, Cash, Accounts Payable | Net Income, Depreciation, Capital Expenditures, Net Debt |
| Primary Utility | Measures short-term buffer against market disruptions | Measures real-time cash generation power |
| Treasury Goal | Optimize working capital ratios (keep between 1.2x and 2.0x) | Maintain robust positive operating cash flow |
How did a mismatch in working capital mechanics force Toys “R” Us into bankruptcy?
The structural collapse of Toys “R” Us illustrates how a mismatch between working capital and cash flow triggers bankruptcy.
Prior to filing for Chapter 11 protection, the massive toy retailer recorded positive net working capital on its balance sheet. The company held billions of dollars in current assets. However, almost all of those assets existed in the form of physical toy inventory packed inside retail warehouses.
As the winter holidays approached, sales velocity slowed due to digital commerce competition. The inventory sat idle on the shelves. Meanwhile, the company’s massive short-term debt interest obligations came due.
Because the business could not convert physical toys into cash rapidly enough, operating cash flow turned deeply negative. This catastrophic mismatch forced the retail giant to file for bankruptcy, proving that inventory-heavy working capital cannot save a business when cash flow runs dry.
How does the cash conversion cycle drive your real-time liquid runway?
Our proprietary analysis exposes how the Cash Conversion Cycle (CCC) binds working capital and cash flow together.
Many corporate CFOs focus entirely on static ratios like the current ratio ($Current Assets / Current Liabilities$). However, academic studies confirm that the static current ratio fails to predict modern liquidity crises. Instead, treasurers rely on the Cash Conversion Cycle to measure how quickly working capital assets convert back into liquid cash.
The cash conversion cycle formula
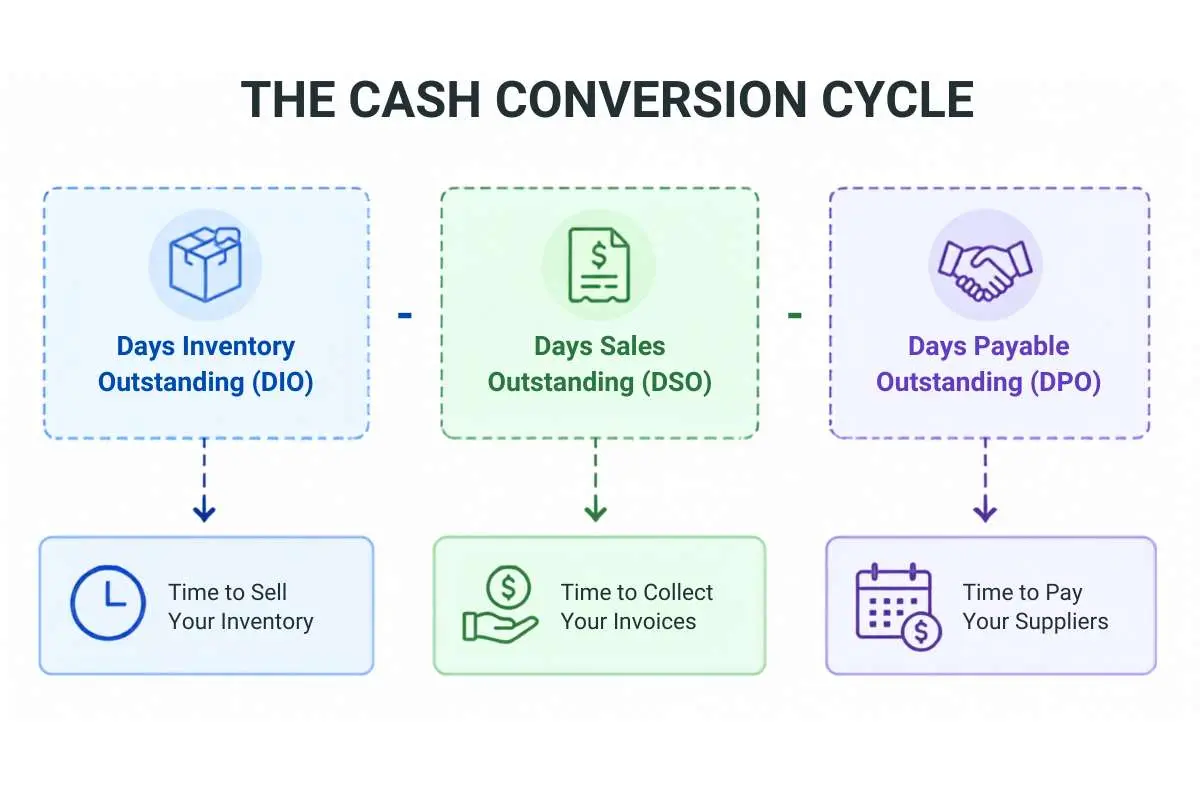
CCC = DIO + DSO – DPO
Where:
- Days Inventory Outstanding (DIO): The average number of days your company holds inventory before selling it.
- Days Sales Outstanding (DSO): The average number of days you wait to collect cash from customers after a sale.
- Days Payable Outstanding (DPO): The average number of days you take to pay your suppliers for raw materials.
The operational drag of trapped liquidity
According to the J.P. Morgan Working Capital Index Report, S&P 1500 companies frequently tie up near-record levels of capital, leaving approximately $707 billion in trapped liquidity across key industries. This massive volume of capital remains completely frozen on balance sheets due to extended DSO and swollen inventory pipelines.
When your DIO or DSO stretches outward, your net working capital requirements climb. Because your cash is locked inside unbilled accounts receivable or unsold warehouse stock, your operational cash flow declines.
By utilizing our interactive simulator above, you can directly visualize how shortening your collection cycles instantly unlocks operating cash flow, turning static balance sheet values into spendable capital.
What operational strategies unlock trapped cash flow from your balance sheet?
To optimize working capital and cash flow simultaneously, you must automate your receivables tracking. Businesses lose millions in operational velocity simply because they run archaic billing systems.
1. Accelerate accounts receivable (AR)
- Offer Early Payment Incentives: Implement dynamic discounting structures. Offer customers a 2% discount if they settle their invoices within 10 days (2/10 Net 30 terms).
- Digitize the Collections Workflow: Use automated payment platforms to distribute invoices instantly. Electronic payment networks eliminate mail delays and cut your Days Sales Outstanding (DSO) by up to 20%.
2. Streamline inventory turnovers
- Deploy Just-In-Time (JIT) Inventory Models: Avoid purchasing massive quantities of raw materials in advance. Coordinate with suppliers to match inventory deliveries directly with real-time manufacturing demand.
- Expose and Liquidate Dead Stock: Audit your warehouses quarterly. Sell off slow-moving inventory at a discount to free up storage space and inject immediate cash back into your operating bank accounts.
3. Manage accounts payable (AP) strategically
- Negotiate Extended Terms: Work with your vendor network to stretch payment deadlines from 30 days to 60 days. This extension preserves your cash reserve without incurring financing interest.
- Avoid Early Payment Unless Discounted: Do not pay suppliers early unless they offer verified, lucrative cash discounts. Keep your funds in high-yield corporate cash accounts until the exact due date.
How do modern leaders use liquidity to preserve institutional autonomy?

The focus on liquidity management is shifting at the highest levels of global business. Female financial executives increasingly utilize working capital and cash flow management to secure institutional trust.
According to data tracking gender-diverse corporate teams, organizations featuring diverse leadership achieve higher cash-flow-to-debt ratios and more stable balance sheets. These executives prioritize cash generation efficiency over high-risk leveraged acquisitions, protecting their companies during periods of extreme market volatility.
What are the most common questions regarding corporate liquidity?
1. How does a rapid increase in sales affect working capital and cash flow?
A sudden explosion in sales often creates a severe, unexpected liquidity crunch. When sales climb rapidly, you must purchase additional raw materials (raising inventory) and extend more credit to buyers (raising accounts receivable).
Because you spend cash up front to manufacture goods while waiting 30 to 60 days for customer payments, your net working capital requirements expand. This process drains your physical bank balance, creating deeply negative operating cash flow during the expansion sprint.
2. What is the SEC guidance surrounding short-term corporate liquidity?
The Securities and Exchange Commission (SEC) mandates detailed disclosures regarding corporate liquidity and capital resources within the Management’s Discussion and Analysis (MD&A) section. Under SEC Interpretive Release 33-9144, public registrants must identify all internal and external sources of liquidity, explain intra-period variations in short-term borrowings, and flag any known trends or uncertainties that could materially reduce their operational cash reserves.
3. Can a company have positive working capital but negative cash flow?
Yes. A company displays positive working capital when its current assets exceed its current liabilities. However, if those assets are locked up inside illiquid inventory or slow-paying customer accounts, the firm lacks spendable cash. Consequently, the business experiences negative cash flow as it continuously spends cash on daily payroll, overhead, and supplier bills.
4. What is a healthy current ratio for an enterprise business?
Treasury departments generally target a current ratio between 1.2x and 2.0x. A ratio below 1.0x indicates that the company faces severe short-term solvency risk, meaning upcoming liabilities exceed liquid resources. A ratio above 2.0x often indicates that management is holding too much idle cash or excess inventory, wasting the potential of that capital to drive strategic business expansion.
Concluding thoughts: how do you preserve your enterprise freedom?
Liquid capital is the lifeblood of operational independence. Debt financing provides temporary relief, but it exposes your enterprise to rising interest rates and strict lender covenants.
By continuously auditing working capital and cash flow, you preserve your company’s operational independence. Implement automated receivables tracking, manage your inventory pipelines with extreme precision, and convert your balance sheet assets into active, strategic cash reserves to sustain long-term business growth.
Sources and References
To maintain maximum data transparency and authoritativeness, review the primary regulatory filings and institutional research indexes utilized throughout this playbook below:
- Trapped Liquidity and Working Capital Baselines: J.P. Morgan Global Payments and Working Capital Index Portal
- Middle-Market Working Capital Performance: Visa & PYMNTS Intelligence Growth Corporates Working Capital Index (September 2024)
- Federal SEC Liquidity Disclosure Requirements: SEC Division of Corporation Finance – Interpretive Guidance Release 33-9144 on Presentation of Liquidity and Capital Resources
- Comparative Financial Metric Research: Costa John Doctoral Dissertation: A Comparison of the Current Ratio and the Cash Conversion Cycle in Evaluating Working Capital Cash Flows