

A company can tell you how many meetings happened last month. It can count messages, shared files, calls, and activity. It may even have a dashboard showing all of it. But can it tell you whether that activity actually made the business better?
That is where measuring collaboration effectiveness gets harder. More meetings can mean better coordination, but they can just as easily signal friction. The question is whether collaboration improves decisions, information flow, execution, and outcomes.
At The Enterprise World, we approach this as a business capability, using connected dimensions and Collaboration Kpis Metrics to understand what collaboration delivers.
Why Collaboration Activity Does Not Tell You Whether Collaboration Works?
Meetings, messages, emails, shared documents, platform usage, attendance. Businesses have plenty of numbers showing that people are communicating. The problem is that activity alone does not prove collaboration is working.
The activity trap
Common collaboration metrics include:
- Number of meetings held
- Messages and emails sent
- Documents shared
- Collaboration platform adoption
- Meeting attendance
These are useful signals, but they tell only part of the story. A busy collaboration platform can still hide slow decisions, repeated work, or teams struggling to get the information they need.
Activity is not the outcome
Consider a meeting with 40 people. The attendance figure may look impressive, but the better question is simple: Did those 40 people help make a decision that would otherwise have taken longer?
That distinction matters when using Collaboration Kpis Metrics. The goal is not to prove that people are busy communicating. It is to understand whether that communication improves the work.
Microsoft’s Work Trend Index found that employees spend 57% of their Microsoft 365 time communicating and 43% creating, while 68% say they lack enough uninterrupted focus time.
What leaders actually need to know
For a CEO Collaboration Strategy, the useful question is not whether Slack, Teams, email, or meetings became more active. It is whether teams are making better decisions, moving faster, and executing strategy with less friction.
If more communication were automatically better, that 57% figure would be a rather awkward statistic.
TEW’s 5-Dimension Collaboration Effectiveness Framework
If activity alone cannot tell an enterprise whether collaboration works, it needs a better way to look at the whole picture. TEW’s proprietary 5-dimension Collaboration Effectiveness Framework does exactly that. Instead of asking how much people communicate, it looks at five connected questions.
1. Connection: Are the right people connected?
Good collaboration starts with access to the people who have the right knowledge, authority, or expertise. That does not mean connecting everyone to everyone. That is how you get organisational spaghetti. The goal is to make the right connections available when they matter.
2. Information Flow: Does useful information move?
A team can have excellent internal communication and still struggle if useful knowledge stays trapped inside departments, teams, or individual inboxes. This dimension looks at whether information reaches the people who need it, when they need it, without unnecessary detours.
3. Decision Quality: Does collaboration improve decisions?
Faster is not always better. A rushed decision is still a bad decision if the right expertise never reached the conversation. This dimension considers whether collaboration brings the right perspectives together and helps teams make sound decisions with enough context.
4. Execution: Does collaboration help work move?
This is where collaboration meets the daily grind. Look at handoffs, delays, duplicated work, unclear ownership, and coordination friction. Effective enterprise collaboration, alongside a strong collaborative leadership style and a culture built for cooperation, should make work easier to move, not create another layer around it.
5. Business Impact: Does collaboration create value?
The final question is the one executives eventually ask: what changed because people collaborated? The answer might show up in lower costs, faster project delivery, stronger customer outcomes, higher productivity, more revenue, or better innovation.
Together, these dimensions give Collaboration KPIs Metrics a purpose. They turn isolated numbers into a broader view of whether collaboration is actually helping the business.
The 5 Collaboration KPIs Metrics Every Enterprise Should Track
The framework gives us the structure. The next question is more practical: what should an enterprise actually measure? The right Collaboration Kpis Metrics should connect back to the five dimensions above, giving leaders a clearer picture of where collaboration is helping and where it is getting in the way.
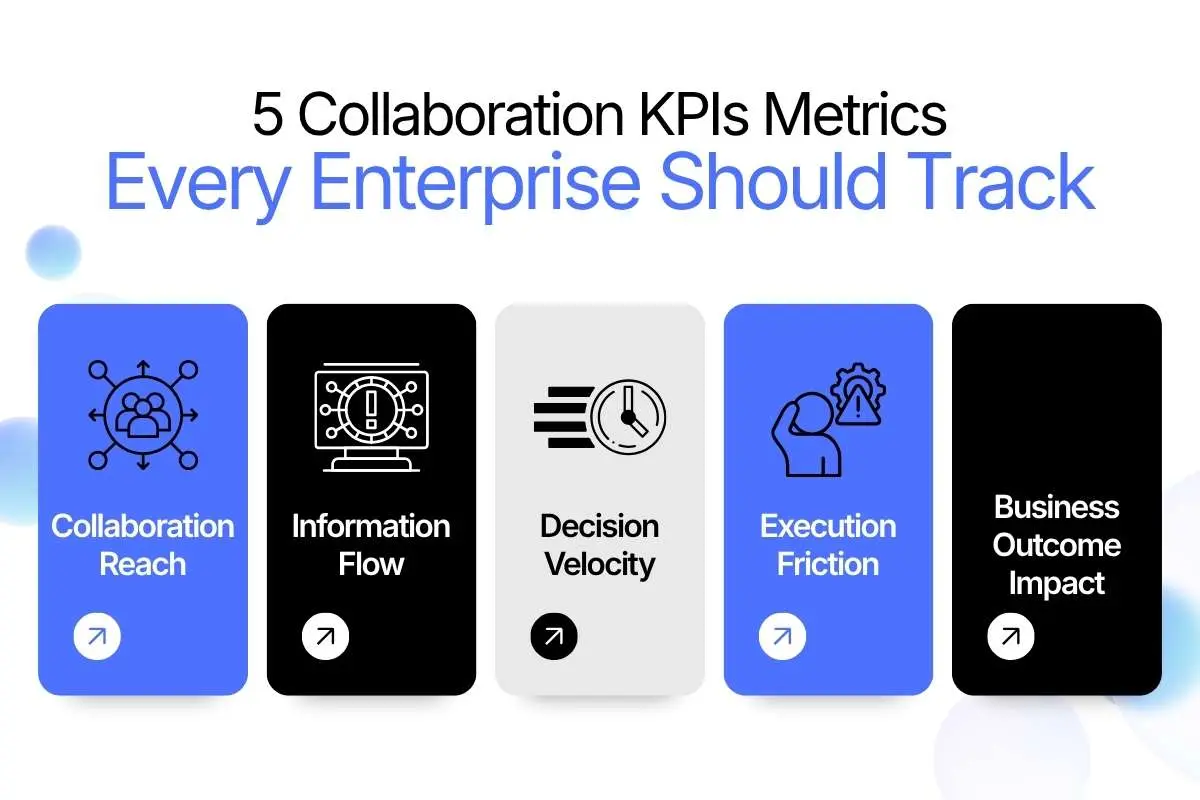
| KPI | What it measures | Useful signal |
| Collaboration Reach | Whether the right teams and people are connected | Cross-functional participation and network reach |
| Information Flow | Whether useful knowledge moves across organisational boundaries | Handoff time, information-sharing patterns and knowledge access |
| Decision Velocity | How quickly teams move from discussion to a sound decision | Time from issue identification to decision |
| Execution Friction | Where collaboration creates delays or duplicated effort | Handoff delays, rework and unclear ownership |
| Business Outcome Impact | Whether collaboration contributes to measurable results | Project speed, cost, revenue, customer outcomes or innovation |
Why these five matter
- Collaboration Reach asks whether teams are connected beyond their immediate circles. A department can be highly efficient internally while missing the expertise it needs elsewhere.
- Information Flow looks at what happens to knowledge once it is created. If useful information stays buried inside one function, other teams may simply recreate the work.
- Decision Velocity measures whether collaboration helps people reach decisions without unnecessary delay. Speed matters, but so does decision quality.
- Execution Friction identifies the coordination problems that slow work down, from repeated handoffs to duplicated effort. This becomes particularly useful when assessing How to Improve Remote Team Collaboration, where distance can make small coordination problems harder to spot.
- Business Outcome Impact connects collaboration to the results leadership actually cares about. These KPIs work together because one number rarely tells the whole story.
Organisational Network Analysis Reveals What Standard Metrics Miss
An org chart tells you who reports to whom. It does not necessarily tell you who people actually rely on to get work done. That is where Organisational Network Analysis (ONA) becomes useful.
What ONA can reveal
Instead of looking only at formal reporting lines, ONA maps real working relationships. It can show:
- Who communicates with whom
- Where important knowledge travels
- Which people connect different teams
- Where relationships are weak or missing
- Where collaboration is too heavily concentrated
Why the hidden network matters
Imagine one employee is the person everyone goes to for a particular piece of knowledge. On the org chart, they may look completely ordinary. On the collaboration network, they may be carrying half the department on their back.
That matters for Cross-Functional Collaboration and Collaboration Between Departments. A business can have the right structure on paper while still depending heavily on a handful of informal connectors.
Where ONA fits
ONA adds context to Collaboration Kpis Metrics by showing where collaboration happens and who enables it. It strengthens two dimensions of TEW’s framework: Connection and Information Flow.
The result is a more useful picture of collaboration, not just a busier dashboard.
How to Present Collaboration ROI to a CFO

Eventually, every collaboration initiative faces the same uncomfortable question: Was it worth the investment? A CFO-ready case should make that answer traceable, rather than dressing up activity numbers as financial results.
TEW’s four-stage ROI model
Investment → Behaviour Change → Operational Impact → Financial Outcome
| Stage | What to show |
| Investment | Technology, training, process redesign, collaboration programmes, or change management |
| Behaviour Change | Fewer unnecessary meetings, faster information access, stronger cross-functional participation, or fewer handoff delays |
| Operational Impact | Faster decisions, shorter project cycles, less rework, or lower coordination time |
| Financial Outcome | Labour savings, earlier revenue, lower operating costs, stronger retention, or greater project capacity |
The important part is not claiming that every improvement came from collaboration. Collaboration KPIs Metrics should show the measured change, while the ROI case should explain how much of that change can reasonably be attributed to the intervention.
This distinction matters when diagnosing Why Do Business Collaborations Fail. Measurement can reveal whether the real problem sits in technology, processes, leadership, incentives, or coordination.
McKinsey estimated that social technologies could potentially improve interaction-worker productivity by 20% to 25%, while noting that organisations need workflow and behavioural changes to capture that value.
Measuring Collaboration Effectiveness Means Connecting the Pieces
Collaboration KPIs Metrics work best when they are treated as part of a system rather than a collection of numbers.
How the pieces fit together
Framework → KPIs → ONA → Business outcome
- Framework: Defines the five dimensions of effective collaboration.
- KPIs: Turn those dimensions into measurable signals.
- ONA: Shows how people actually connect and where information moves.
- ROI analysis: Connects the findings to operational and financial value.
That is what measuring collaboration effectiveness should ultimately achieve. The enterprise does not need to prove that employees are simply collaborating more. It needs to know whether they are better connected, better informed, making sounder decisions, and moving work forward with less friction.
In that sense, measuring collaboration effectiveness is about connecting activity to outcomes. A busy dashboard is easy to build. A useful one takes considerably more thought.
What Changes When AI Joins the Collaboration Network?

AI is becoming part of the working network, not just another workplace tool. Microsoft’s 2025 Work Trend Index found that 82% of leaders saw the year as pivotal for rethinking strategy and operations, while 82% expected to use digital labor to expand workforce capacity.
The measurement shift
As AI takes on coordination work, Future of Business Collaboration, AI in business collaboration, collaboration in the age of AI, and agentic AI collaboration enterprise will make human communication volume a less useful measure. Collaboration Kpis Metrics will need to focus more closely on outcomes, network effectiveness, and the value created by human and AI collaboration together.
Conclusion: Collaboration Is Only Valuable When the Business Can See the Difference
Collaboration should not be measured by how busy the communication layer looks. A full calendar, overflowing inbox, or endless stream of messages can still leave a business with slow decisions and tangled execution.
The better measure is whether the organisation connects the right people, moves useful knowledge, makes better decisions, reduces friction, and delivers measurable value through Collaboration KPIs Metrics.
That is the thinking behind TEW’s approach to Business Collaboration. When collaboration is measured against what the business actually needs to achieve, it becomes less about activity and more about progress.
Frequently Asked Questions About Collaboration KPIs Metrics
1. What are collaboration KPIs?
Collaboration KPIs are measurable indicators that show whether teamwork improves communication, decision-making, execution, productivity, and business outcomes.
2. How do you measure collaboration effectiveness?
Measure collaboration effectiveness by tracking connection, information flow, decision-making, execution friction, and measurable business outcomes together.
3. What is the most important among collaboration KPIs metrics?
Business outcome impact is the most important KPI because it connects collaboration activity to measurable results such as cost, revenue, productivity, or delivery.
4. How does Organisational Network Analysis measure collaboration?
Organisational Network Analysis maps actual working relationships to identify information flows, collaboration gaps, key connectors, and over-reliance on specific employees.
5. How can companies calculate the ROI of collaboration?
Companies can estimate collaboration ROI by linking investment to behaviour change, operational improvements, and measurable financial outcomes while separating correlation from attribution.