

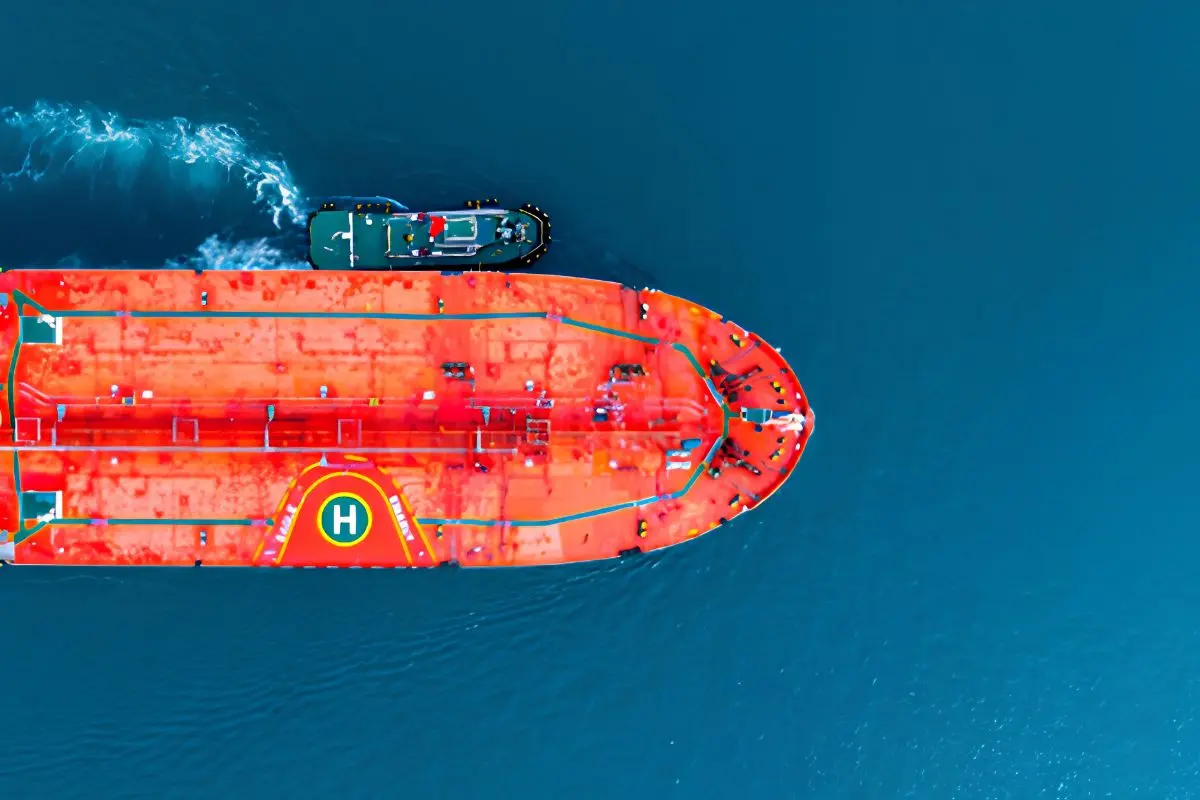
Few boardroom conversations have avoided commodity prices this year. When conflict in the Middle East disrupted tanker traffic through the Strait of Hormuz in the spring, Brent crude posted what the World Bank described as its largest monthly rise on record. Copper, aluminum and tin have since reached record highs, and the World Bank now expects its overall commodity price index to end 2026 with a 23% increase.
These market swings have put the commodity specialists inside consulting firms in unusually high demand amid commodity price volatility. But their clients rarely ask for a simple price prediction. They want to know what a move means for margins, how quickly it will arrive, and what to do about it. Answering these questions requires a toolkit that combines market data, financial analysis, and clear reporting.
Charting platforms

Volatility is easier to explain when a client can see it. That is why advisory teams prefer comparing price movements of different markets through browser-based charting systems rather than static spreadsheets. TradingView, one of the leading charting platforms for financial markets, allows analysts to arrange up to eight synchronized charts in a single layout. Its Bar Replay feature also lets users revisit historical price movements and examine how markets responded to a particular event. This can help consultants explain a market shock to clients using actual price behavior rather than relying on static charts..
The cross-asset view matters because commodity price movements can affect currencies and business costs at the same time. The Canadian dollar and Norwegian krone, for example, often respond to changes in oil prices, while the Australian dollar can be influenced by movements in metal prices. A US importer buying under a Canadian contract is effectively managing two exposures at once. Plotting USD/CAD alongside West Texas Intermediate (WTI) crude prices can help consultants examine how these markets have moved in relation to each other and explain the potential implications for the client’s costs from commodity price volatility.
Positioning data
Price shows what happened, but positioning offers clues about who holds exposure. Each week, the Commodity Futures Trading Commission (CFTC) publishes its Commitments of Traders (COT) report, which breaks down open interest in US futures markets by trader category. The figures reflect positions as of Tuesday and are generally released Friday afternoon, meaning it provides a snapshot of the market rather than a real-time view. The disaggregated report is particularly useful for commodity analysis because it separates traders into categories such as producers, merchants, swap dealers, and managed money. Consultants can track changes in these positions to assess whether speculative exposure is growing or becoming concentrated. Many analysts read crowded speculative positioning as a sign that any reversal could be abrupt, although positioning data alone cannot predict when one will occur.
Market forecasts and volatility indicators
Historical volatility shows how much prices have moved in the past, while options markets offer an indication of how much volatility traders expect in the future. CME Group’s CVOL indexes measure expected volatility over a 30-day period using options prices across several commodity markets, including WTI crude, gold, copper, and agricultural products. For a procurement director weighing a fixed-price supply contract, rising readings can indicate that the market expects greater price uncertainty. This may also mean higher costs for options-based protection, even when spot prices appear relatively stable.
Consultants also compare these market signals with forecasts from major public institutions. The World Bank’s Commodity Markets Outlook is one of the important resources. Published twice a year, this report sets out price forecasts alongside risk scenarios. Its October 2026 edition puts Brent at an average of $91 a barrel this year, up from $69 in 2025. The USDA’s monthly World Agricultural Supply and Demand Estimates and the Energy Information Administration’s Short-Term Energy Outlook provide insights into agriculture and energy markets.
Exposure analytics
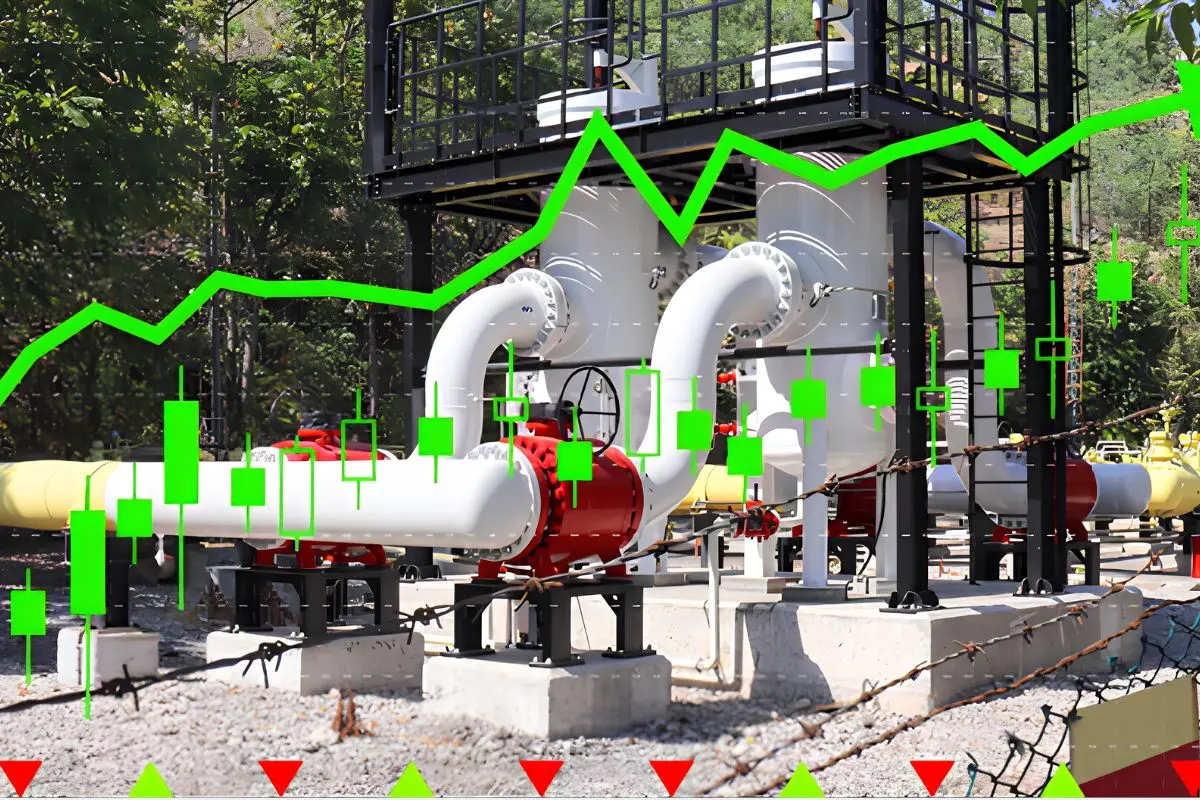
Market data becomes useful advice when consultants connect it to a client’s own financial and operational figures. Most firms feed terminal data from providers such as Bloomberg into Excel or Python models, then run correlation analysis, value-at-risk calculations, stress tests and backtests to show how changes in commodity prices might affect a client’s costs, revenues and profit margins during periods of commodity price volatility.
A case involving an agrichemicals company by McKinsey shows how backtesting can uncover costly gaps in commodity risk management. In this case study, the company that manufactures fertilizer using natural gas had agreed to sell most of its fertilizer at fixed prices up to six months in advance, but secured natural gas prices for only two months of production. As a result, rising gas prices could increase its production costs without allowing it to raise the prices already agreed with customers. McKinsey’s backtesting suggested that a rolling hedge aligned with fertilizer sales volumes could have helped the company avoid an estimated €15 million to €18 million in annual losses.
Sensitivity analysis offers another way to measure a company’s exposure to commodity price movements. Southwest Airlines discontinued its long-running fuel hedging program in 2025, citing higher premium costs over time, and its annual report now notes that every one-cent change in jet fuel prices would shift its expected 2026 fuel expense by roughly $22 million. This kind of analysis helps company leaders understand how changes in commodity prices could affect operating costs, whether or not they use hedging.
Final deliverables

The final deliverables of a consultant should include practical tools to help clients understand and manage exposure to commodity price movements. An exposure map, for example, can be really useful for identifying the revenue streams and operating costs most sensitive to price changes. Creating a hedging policy also helps define the company’s risk tolerance and approved financial instruments. Used alongside a good reporting framework these tools allow the risk committee to review market developments efficiently.
Consultants also develop scenario playbooks and price-level triggers, so a client knows in advance how it will respond if crude breaks a given threshold. This way, companies can follow an established plan rather than make decisions under pressure during a period of market volatility.
Sound judgment remains essential
No tool can replace sound judgment when interpreting commodity price volatility. A positioning report, a volatility reading, and a World Bank forecast can each point in a different direction, and the value lies in weighing them and explaining the trade-offs clearly. This year has tested that skill harder than at any point since the 2022 energy crisis. Firms with a rigorous, multi-source toolkit are turning volatility into decisions clients can act on.