
In the previous blog, we learned about Customer Acquisition Cost, but how do we determine how much we can afford to spend on acquiring one consumer? In business terms, this is called Customer Lifetime Value or CLV / LTV.
It is a fancy term that explains to an entrepreneur how much return a customer brings. In simple terms, it is the ROI of CAC. At its core, Customer Lifetime Value is a metric that represents the total amount of money a customer is expected to spend with your business during their entire relationship with you.
Let’s understand it a little bit more, shall we?
Two Customer Lifetime Value Formulas Every Serious Founder Must Understand
CLV is an indicator that models the net present value of the entire future relationship with a customer.
While simple formulas look at total revenue, a truly detailed CLV accounts for the profit margin, subtracting the costs of serving that customer (support, shipping, returns) from the revenue they generate. It treats a customer as an asset that appreciates or depreciates over time.
Here’s the simple formula for calculating a Customer Lifetime Value:
Average Revenue Per User×Average Customer Lifespan
A more detailed formula for CLV is:
Average Revenue per account ×Gross Margin %Logo Churn Rate
1. The Simple Formula:
This is the “Back of the Napkin” calculation. It focuses entirely on Top-line Revenue.
- Average Revenue per User (ARPU): This is the average amount of money a customer pays you in a specific period (usually a month or a year).
- Average Customer Lifespan: How long they stay with you before they stop buying.
The Logic: If a Netflix subscriber pays $15/month (ARPU) and stays for 24 months (Lifespan), their CLV is $360.
The Weakness: This formula is dangerous because it ignores costs. If it costs Netflix $16/month in licensing fees and server costs to host that user, a $360 CLV actually means the company is losing money on that customer.
2. The Advanced Formula
This is the “Financial Reality” calculation. It shifts the focus to Bottom-line Profitability.
The Numerator:
Instead of looking at total revenue, this calculates your Gross Profit per customer.
Gross Margin %: This represents what’s left after the direct costs of delivering the service (COGS).
Example: If your ARPU is $100 but it costs you $30 to provide the service, your Gross Margin is 70%. Your “Value” starts at $70, not $100.
The Denominator:
This is the percentage of customers who leave in a given period.
Why divide by Churn? In math, dividing by the Churn Rate is the shortcut for calculating the Lifespan.
Example: If your monthly churn is 5% ($0.05$), then $1 / 0.05 = 20$ months.
Putting it all together:
Let’s solve a simple problem to help you understand CLV better. Imagine you have a SaaS company where:
- ARPU: $100
- Gross Margin: 80% ($0.80$)
- Churn Rate: 2% ($0.02$)
CLV= 100 ×0.800.02
∴CLV= 800.02
∴CLV=$4000
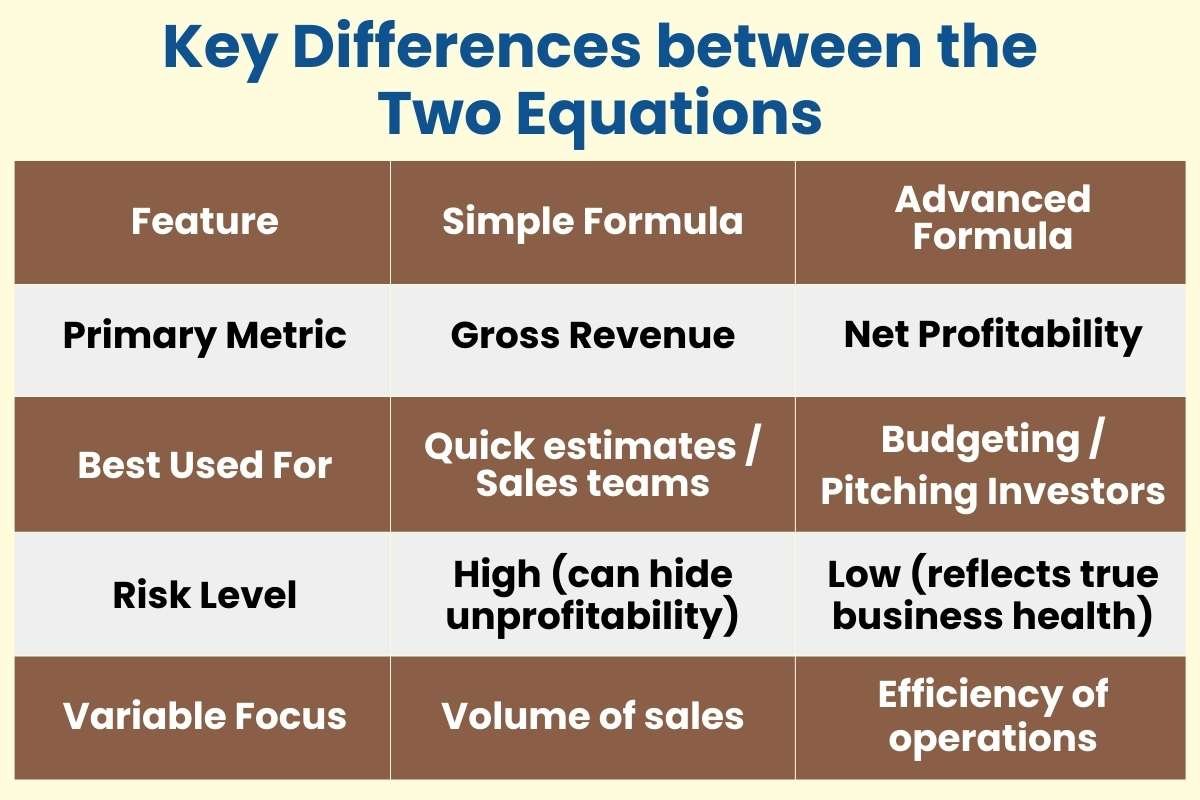
Key Differences between the Two Equations:
| Feature | Simple Formula | Advanced Formula |
|---|---|---|
| Primary Metric | Gross Revenue | Net Profitability |
| Best Used For | Quick estimates / Sales teams | Budgeting / Pitching Investors |
| Risk Level | High (can hide unprofitability) | Low (reflects true business health) |
| Variable Focus | Volume of sales | Efficiency of operations |
Understanding the Three Customer Lifetime Value Drivers that Separate Growth from Stagnation
To understand CLV deeply, you have to analyze the three variables that drive it:
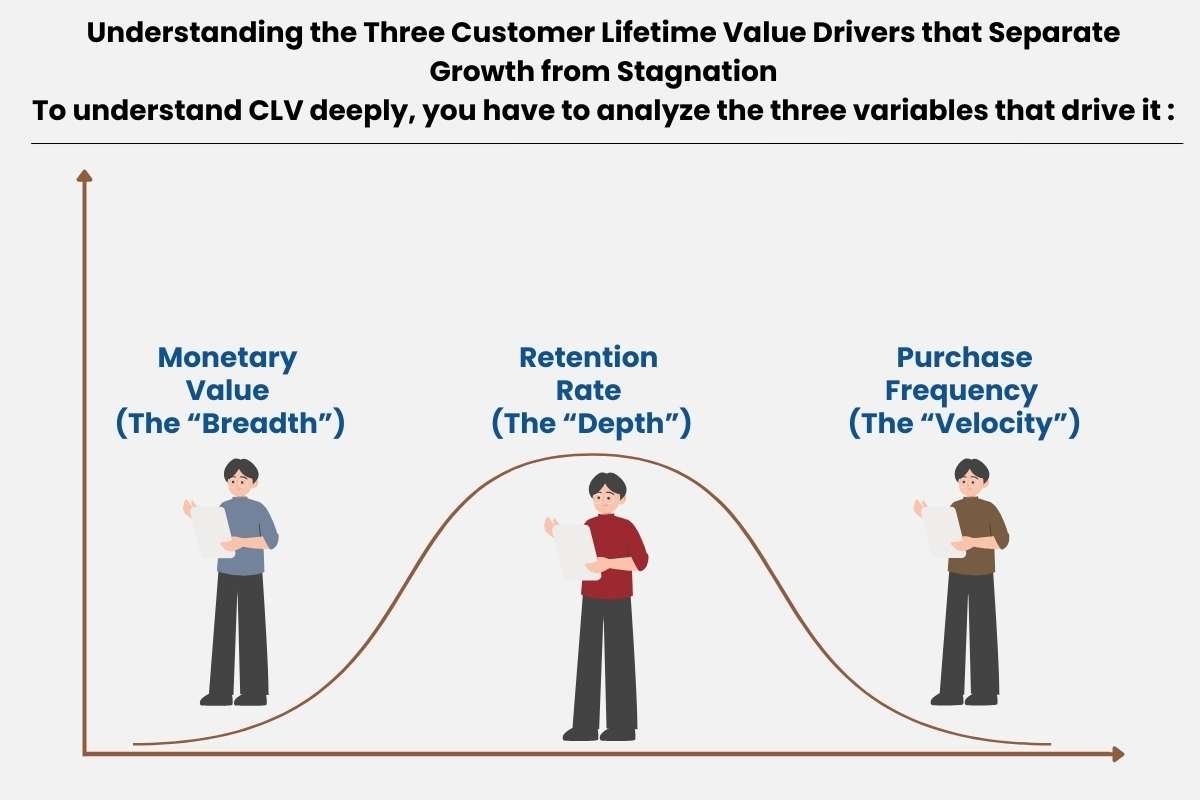
A. Monetary Value (The “Breadth”)
This is the average size of a transaction. This isn’t just the price tag. It includes the effectiveness of your pricing strategy and your ability to bundle products. A high monetary value suggests your product is perceived as high-value or essential.
B. Retention Rate (The “Depth”)
This is the duration of the relationship. This is the inverse of Churn. If you lose 10% of your customers every year, your average lifespan is 10 years. If you lose 50%, it’s 2 years. Retention is often the most sensitive lever; increasing retention by 5% can boost profits by 25% to 95%.
C. Purchase Frequency (The “Velocity”)
This is how often a customer cycles back to your business. This measures habit formation. For a coffee shop, velocity is daily; for a car dealership, it’s every five years. Understanding the natural “buying cycle” of your industry is critical to defining a “good” Customer Lifetime Value.
How Does CLV Shape Marketing, Retention, and Executive Decisions?
Now that we know what CLV is and how to calculate it, let’s look at its use cases:
Strategic Marketing and Sales Growth
Organizations use CLV to move beyond metrics like Return on Ad Spend (ROAS), which often ignore the long-term value of the shopper. By focusing on “the customers that matter the most,” businesses can justify higher acquisition costs for shoppers who promise sustained revenue.
The impact is measurable: 81% of marketers agree that monitoring CLV increases sales, and those who measure it well experience significantly higher sales growth (81%) compared to those who do not (57%).
Retention and the Psychology of Value
CLV serves as a primary metric for retention, with 68% of marketers noting that it directly increases customer stay-rates. Since acquiring new customers is more expensive than nurturing existing ones, companies use Customer Lifetime Value data to build “lifelong fans”.
This involves catering to specific generational behaviors, such as the 65% of 18-25 year olds who aim to return to the same store for repeat purchases, or the 30% of the population who remain loyal due to supplementary product offers.
Additionally, the “Hawthorne Effect“ suggests that simply observing and measuring these customer behaviors can sometimes lead to changes in the subjects’ performance or habits.
Operational Implementation and Data

Effective Customer Lifetime Value requires a mix of Historic CLV (past profits) and Predictive CLV (projected revenue). Despite challenges such as cross-device tracking (cited by 45% of marketers) and a lack of in-house skills (26%), 86% of CEOs and owners now consider CLV a high business priority.
Interestingly, research suggests that for discovering usability problems that might affect customer experience, and thus CLV, testing with just five users can uncover approximately 85% of interface issues.
| Metric | Real-World Impact | Supporting Statistic |
|---|---|---|
| Sales Growth | Effective CLV monitoring correlates with higher total sales. | 81% sales gain vs 57% for non-monitors |
| Marketing Timing | CLV allows for more relevant, timely communication. | 79% improvement in marketing timeliness |
| Retention | Focus shifts to keeping existing high-value customers. | 68% of marketers see increased retention |
| Personalization | Data-driven insights lead to bespoke shopper experiences. | 41% report greater customer personalization |
| Executive Buy-In | High-level leadership prioritizes long-term value over ROAS. | 86% of CEOs/Owners view CLV as a priority |
Read Next:
- A Complete Guide to Customer Acquisition Cost in 2026: Here’s Everything You Need to Know
- What Really Happens Inside a Customer Acquisition Funnel? The Secrets Marketers Don’t Share
What Separates Short-Term Buyers from Lifetime Customers?
While formulas provide the math, the actual value of a customer is built on the human experience they have with your brand. Think of these factors as the leathery roots that keep a customer attached to your business tree.
1. The First Date Experience (Onboarding)
The way a customer is treated during their first 30 days is the strongest predictor of their lifetime value. If the setup is confusing or the product is hard to use, they will leave before you ever break even on the cost of finding them. A smooth onboarding process creates immediate confidence.
2. Emotional Resonance and Shared Values
Modern customers stay longer with brands that stand for something they believe in. Whether it’s a commitment to sustainability, supporting local communities, or a specific brand vibe, emotional loyalty is much harder for a competitor to break than a loyalty based purely on price.
3. The Low Friction Factor
Convenience is a massive driver of long-term value. If your website remembers their credit card, if your Buy Again button is one click away, or if your returns process is painless, customers will stay simply because it is easier than starting over with someone else. We often call this the cost of switching.
4. Proactive Problem Solving
A customer who has a problem that is solved brilliantly is often more loyal than a customer who never had a problem at all. This is because the brand has proven it has its back. Proactive support, reaching out to fix an issue before the customer even notices, creates a wow factor that extends the relationship by years.
5. Product Evolution and Relevance
If your product stays the same while the world changes, your customer’s lifetime with you will naturally end. High CLV brands constantly update their offerings to stay relevant to the customer’s changing life stages (e.g., a clothing brand that transitions a customer from college apparel to professional workwear).
What Do the Top Performers Do Differently to Increase Customer Lifetime Value?
To improve Customer Lifetime Value (CLV), a business must shift from chasing one-off transactions to nurturing long-term relationships. High-impact strategies focus on retention, personalization, and data-driven tactics, often yielding measurable gains like 20% retention boosts or 3-18% CLV uplifts in real cases.
1. Personalization and Predictive Tactics
Modern Customer Lifetime Value improvement relies on Hyper-Personalization, where businesses use machine learning to suggest products before a customer even realizes they need them.
AI models can now flag at-risk customers up to six weeks before they leave. By offering individualized deals, like exclusive discounts or early access, companies can proactively save these relationships.
Tailored recommendations drive a 10–15% revenue uplift on average. For retail giants such as Amazon, these AI-powered features contribute to nearly 35% of total revenue.
Case Study (Maturity): Mature brands leading in personalization are 48% more likely to exceed their revenue goals and 71% more likely to report improved customer loyalty.
2. Loyalty and Retention Architecture
Loyalty programs are no longer just about points; they are about creating behavioral habits.
Starbucks Rewards is the gold standard, with members being 5.6 times more likely to visit daily. Members contribute to 59% of total U.S. sales, spending 3x more per visit than non-members.
Research shows that customers who feel an emotional connection to a brand have a 306% higher lifetime value. A mere 5% increase in retention can lead to a profit boost of 25% to 95% because loyal customers are cheaper to serve and more likely to refer others.
3. Lead Nurturing and Proactive Support
Improving the velocity of a customer’s journey from their first interaction to their first purchase is critical for long-term value.
The online retailer Hear and Play Music used automated, personal lead nurturing to achieve a staggering 416% increase in CLV. By automating relationships, they converted leads into high-value buyers much faster.
In the financial sector, one firm implemented advanced Customer Lifetime Value modeling and saw a 3% growth in CLV alongside an 18% reduction in churn within just six months. Using proactive AI chatbots (like DEF Telecom) reduces friction and increases satisfaction, which prevents accidental churn caused by unresolved technical issues.
The Measurement Challenges That Undermine Customer Lifetime Value
Measuring Customer Lifetime Value (CLV) is often described as simple in theory but messy in practice. While the math is straightforward, the data fueling it is often fragmented, leading to a garbage-in, garbage-out scenario.
The Data Silo and Attribution Gap
The primary hurdle for most organizations is the lack of a Single Customer View. When customer data lives in disconnected buckets, marketing clicks in one tool, sales records in another, and support tickets in a third, the business cannot see the full journey.
This fragmentation is compounded by cross-device tracking issues; about 45% of marketers struggle to link a single user’s activity across a phone, tablet, and laptop. Without this link, a high-value customer may appear as three separate, low-value strangers, leading to poor strategic decisions.
The Predictive Risk and Changing Life Stages
Most Customer Lifetime Value models rely on the assumption that past behavior predicts future action, which is a dangerous simplification. Customers are not static; their needs change as they move through different life stages.
For example, a high-spending customer at a baby supply store will naturally churn as their child grows, regardless of how good the service is. If a model fails to account for these life-cycle transitions or external economic disruptions, it will produce an inflated and unrealistic Predicted CLV.
The Hidden Cost to Serve
A common mistake is calculating CLV based on revenue rather than Gross Margin. A customer who generates $1,000 in revenue but returns 50% of their orders and calls support ten times a month may actually have a negative lifetime value.
Identifying these hidden costs, such as shipping, labor, and high-touch support, is a complex accounting task. Many companies skip this step, inadvertently spending their entire marketing budget to acquire customers who actually cost the company money to maintain.
The CLV: CAC Ratio: The Metric Investors Check Before Saying Yes
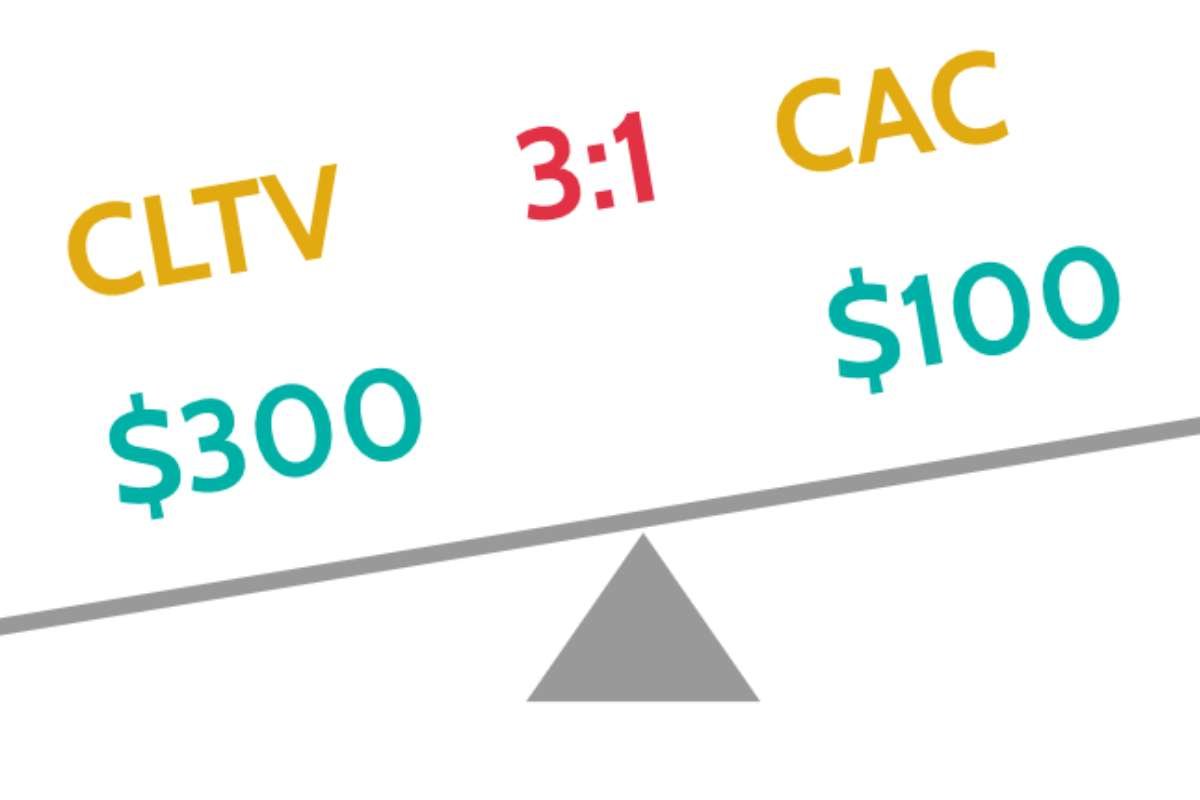
You cannot talk about Customer Lifetime Value without mention it’s partner, CAC (Customer Acquisition Cost). The CLV to CAC Ratio is the efficiency metric for a business. It measures the relationship between the total value a customer brings in (CLV) and the cost spent to acquire that same customer (CAC).
Think of it as the “Return on Investment” for your entire customer relationship. If your CLV is $300 and your CAC is $100, your ratio is 3:1. This means for every $1 you spend on marketing and sales, you get $3 back in value.
The Golden Ratio: 3:1
In the world of SaaS and high-growth startups, 3:1 is considered the Golden Ratio. It indicates that the business is profitable enough to cover its operational costs while still having enough margin to reinvest in further growth. If the ratio climbs to 5:1 or higher, the business is exceptionally efficient, but it might actually be underspending on marketing, potentially leaving growth on the table.
The Danger Zones
When the ratio falls to 1:1 or lower, the business is in a Death Spiral. In this scenario, you are spending exactly as much to get a customer as they are worth over their entire life. Once you factor in salaries, rent, and overhead, the company is losing money on every person it signs up. Conversely, a ratio that is too high (e.g., 10:1) often suggests the company is being too timid with its marketing budget and allowing competitors to capture the market.
| Ratio | Status | Meaning |
|---|---|---|
| 1:1 or less | Critical | You are losing money on every customer acquired. |
| 2:1 | Warning | Barely covering costs, growth will be slow and difficult. |
| 3:1 | Healthy | The standard for a sustainable, scalable business. |
| 5:1+ | High Efficiency | Great margins; consider spending more to grow faster. |
Read Next:
- What Top Brands Know About Customer Acquisition That You Don’t?
- Customer Acquisition Strategy Insights: Proven Methods for Business Growth
Why Ignoring CLV Makes Growth Dangerous?
Knowing your Customer Lifetime Value helps you answer the most important question in business: How much can I afford to spend to acquire one customer?
- Smart Marketing: If a customer’s CLV is $500, spending $100 to acquire them (Customer Acquisition Cost) is a great deal. If their CLV is only $50, you’re losing money.
- Customer Retention: It shifts the focus from getting new people in the door to keeping the people you already have happy.
- Predicting Growth: It helps you forecast future revenue based on your current customer base.
CLV Implementation Summary:
| Goal | Actionable Step | Expected Outcome |
|---|---|---|
| Strategy | Shift from ROAS to CLV: CAC ratio. | Improved long-term profitability. |
| Operations | Break down data silos with a CDP. | Accuracy in customer tracking. |
| Growth | Personalize the First 30 Days. | Reduced early-stage churn. |
| Retention | Tier loyalty based on margin, not just spend. | Protected profit margins. |
Conclusion
Customer Lifetime Value is the compass for sustainable growth. By shifting from one-off transactions to long-term relationships, you stop buying customers and start earning them.
While the data can be complex, the reward is a business built on loyalty rather than luck. The most successful brands realize that understanding a customer’s worth is the only way to stay in business for a lifetime.
FAQs
1. What is a good CLV to CAC ratio?
The industry standard for a healthy, scalable business is 3:1. This means the value of a customer is triple the cost of acquiring them. A 1:1 ratio indicates you are losing money after overhead, while a 5:1 ratio suggests you are highly efficient but perhaps underspending on growth.
2. How is CLV different from Customer Profitability?
Customer Profitability looks at the past (what a person has spent), while Customer Lifetime Value is forward-looking. CLV uses historical data to predict the total future value of the relationship, allowing you to make strategic bets on acquisition today.
3. How often should I calculate CLV?
In most industries, a quarterly review is best. This allows you to see how seasonal changes, new marketing campaigns, or product updates are impacting customer loyalty without getting distracted by week-to-week data noise.


