People often portray trading as flashing screens and complex math problems. But at its core, it is the study of human behavior expressed through price. Technical analysis is the framework traders use to make sense of this behavior. Traders analyze historical price movements and volume to identify repeatable patterns that suggest the market’s next direction.
In 2026, the markets move faster and are more interconnected, making technical analysis more critical than ever. This guide is for beginner to intermediate traders who have moved past the “get rich quick” myths and are working towards understanding technical aspects of trading. We will learn how professional participants use technical tools to manage risk and find opportunities in live markets.
Before starting the blog, it is essential to note that the stock market can be risky. It is not an easy way to get rich, but it is a process that requires study. And that is why we shall take an educational look at understanding technical aspects of trading.
How Charts Guide Entry, Exit, and Risk Discipline?
Technical analysis is the study of market action, primarily through the use of charts, for the purpose of forecasting future price trends. While fundamental analysis looks at “why” a price should move (like earnings reports or economic data), technical analysis focuses on “what” is actually happening on the chart.
Experienced traders do not view understanding technical aspects of trading as a crystal ball to predict the future. Instead, they use these tools for:
- Timing: Deciding exactly when to enter a trade to maximize efficiency.
- Risk Management: Identifying where a trade idea is proven wrong so they can exit with less loss.
- Trade Management: Determining when to take profits as a trend shows signs of slowing down.
Reading the Market Through Structure, Levels, and Timing
For understanding technical aspects of trading, a trader must learn the market structure. It is the “map” of the market. Markets move in three ways: trends (up or down), ranges (sideways), and swings (the individual waves within a trend).
Support and resistance are levels where price has historically struggled to move past. However, modern traders often think in terms of liquidity zones. These are areas where a high volume of orders is likely sitting, usually just above old highs or below old lows.
Timing also plays a massive role. The market behaves differently depending on which global session is active:
- Asia: Characterized by lower volatility and ranging markets.
- London: Known for the “true” trend beginning as European banks open.
- New York: The highest volume session, often seeing reversals or trend continuations.
Now, understanding technical aspects of trading means you must learn about the five tools of technical analysis. Here’s what they are:
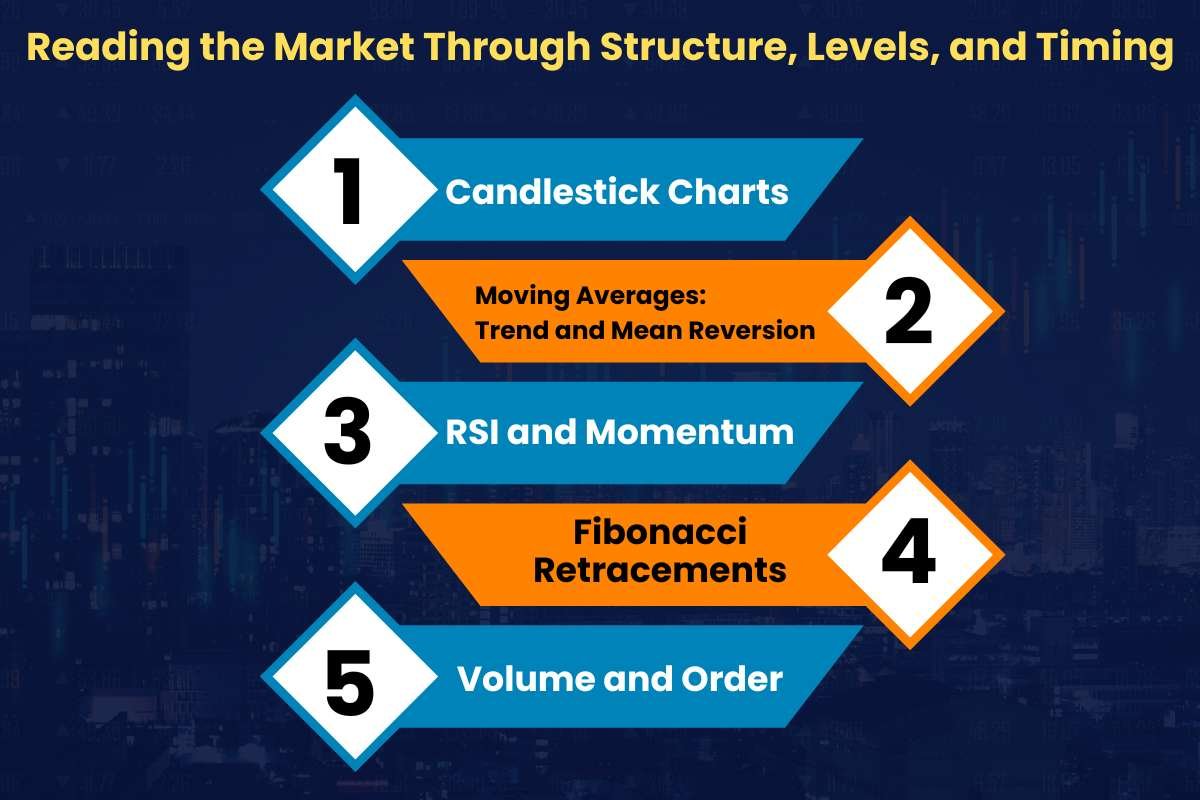
1. Candlestick Charts
Candlestick charts are the most popular way to view price because they tell a story of the battle between buyers and sellers within a specific timeframe. Each “candle” shows the Open, High, Low, and Close (OHLC).
Single Candles and Patterns
Patterns like the Pin Bar (a candle with a long “wick” and small body) or the Engulfing Candle (where one candle completely covers the previous one) are signals of a shift in momentum. A Pin Bar at the bottom of a move suggests that sellers tried to push the price lower, but buyers stepped in and pushed it back up before the period ended.
The Importance of Context
A common beginner mistake is trading a candle pattern in isolation. A bullish engulfing candle in the middle of a sideways range means very little. However, that same candle appearing at a support level during the New York open is much more significant. And always remember, context is king.
2. Moving Averages: Trend and Mean Reversion
Moving Averages (MAs) smooth out price data to create a single flowing line, making it easier to identify the trend.
- Simple Moving Average (SMA): Calculates the average price over a set number of periods.
- Exponential Moving Average (EMA): Gives more weight to recent prices by reacting faster to new information.
Professionals don’t just look for “crossovers” (where a fast MA crosses a slow one). They use MAs as dynamic areas of value. In a strong uptrend, the price often returns to the 20-period or 50-period EMA before bouncing. It is called a “mean reversion.” If the price is too far away from its average, it is often “extended,” and traders wait for it to pull back before entering.
3. RSI and Momentum
The Relative Strength Index (RSI) measures the speed and change of price movements. It oscillates between 0 and 100. Traditionally, stock above 70 is “overbought” and below 30 is “oversold.”
However, in a strong trend, the RSI can stay “overbought” for weeks while the price continues to climb. Instead of looking for reversals, savvy traders use RSI for momentum confirmation.
If price makes a new high and the RSI also makes a new high, the trend is healthy. If price makes a new high but the RSI makes a lower high, it signals that the trend might be losing steam.
4. Fibonacci Retracements
Fibonacci tools draw on mathematical ratios found in nature, and they also influence financial markets as people express their emotions in similar patterns. When a market moves sharply in one direction, it rarely moves in a straight line; it “retraces” a portion of that move before continuing.
Traders focus on the 50% and 61.8% levels as the “Golden Zone” for entries. But these levels aren’t magic. They work best when they align with other factors, such as:
- A prior resistance level that is now acting as support.
- An active moving average.
- A clear trend on a higher timeframe.
The term “confluence” refers to the situation where multiple reasons align to support making a trade.
5. Volume and Order
Volume tells you how much “effort” is behind a price move. If price breaks out of a range on low volume, it is likely a “fakeout.” If it breaks out on high volume, it shows institutional participation.
- Trend Volume: Ideally, volume should increase in the direction of the trend and decrease during pullbacks.
- Exhaustion Spikes: A large volume spike after a prolonged move often indicates that the final “weak hands” have entered the market, suggesting a reversal is imminent.
In 2026, traders analyze order flow by studying the actual buy and sell orders hitting the market. It helps distinguish between aggressive buying and passive selling (absorption).
A Step-by-Step Approach to Technical Trade Execution

To avoid “analysis paralysis,” you need a step-by-step process. Here is a framework used by many professional retail traders for understanding technical aspects of trading:
- Higher Timeframe Bias: Look at the Daily or 4-Hour chart. Is the market trending up, down, or sideways?
- Identify Key Levels: Mark the support, resistance, and liquidity of the nearby zones.
- Wait for the Zone: Do not chase the price. Let it enter your identified area of interest.
- Confirm with Indicators: Use your RSI or Moving Averages to see if momentum is shifting in your favor.
- Look for the Entry Trigger: Find a candlestick pattern (such as a pin bar) that shows buyers or sellers are taking control.
The Role of Risk-to-Reward in Long-Term Trading Survival
You can have a 70% win rate and still lose money if your risk management is poor. Understanding technical aspects of trading helps you define your Stop Loss (where you are wrong) and your Take Profit (where you are satisfied).
A fundamental rule is to seek a Risk-to-Reward ratio of at least 1:2. This means if you are risking $100, you aim to make $200. This mathematical edge allows you to be wrong more than half the time and remain profitable. Daily loss limits and maximum drawdown rules are safety nets to keep a trader in the game long enough to learn.
Key Criteria for Selecting a Reliable Trading Partner

In 2026, the barrier to entry is low, but the risk of choosing the wrong partner is high. When selecting a trusted broker or platform, consider:
- Regulation: Ensure they are under a reputable body (such as the FCA, ASIC, or SEC).
- Execution Quality: Slippage (the difference between your requested price and the filled price) can eat your profits.
- Data Quality: Professional charting software (like TradingView or MetaTrader 5) is essential for accurate technical analysis.
Avoiding Common Beginner Mistakes That Erode Trading Capital
The biggest mistake beginners make is “indicator hopping.” They try one strategy, have two losing trades, and immediately switch to a new indicator. Success in trading comes from mastery, not novelty.
When looking for education or mentorship, look for transparency. Avoid anyone promising “guaranteed returns” or showing only winning trades. Real trading involves losses. A good mentor focuses more on risk management and psychology than on a “secret” entry signal.
Common Pitfalls
- Over-leveraging: Using too much borrowed money, which leads to emotional decision-making.
- Trading every signal: Quality over quantity is the mantra of the professional.
- Ignoring the News: Even technical traders should be aware of various economic releases (like interest rate decisions) that can cause volatility spikes.
Conclusion
Understanding technical aspects of trading is a powerful tool, but it is not a shortcut to wealth. The tools described, moving averages, RSI, and candlesticks, are simply ways to organize market data into a readable format. The true “edge” comes from combining these tools with a deep understanding of market structure, iron-clad risk management, and the discipline to follow a plan.
The best way to learn is to pick one or two tools, apply them to a single market, and record every trade. Over time, you will stop seeing random lines and start seeing the heartbeat of the market. And that’s when you know, you’ve mastered the art of understanding technical aspects of trading.
FAQs
1. What is the best timeframe for technical analysis?
It depends on your style. Day traders often use the 5-minute or 15-minute charts for entries, while swing traders prefer the Daily or 4-hour timeframes. Most professionals use “multi-timeframe analysis” to align short-term entries with long-term trends for better accuracy.
2. Can technical analysis be used for all financial markets?
Understanding technical analysis requires knowledge of price action and human psychology, which are present in stocks, forex, crypto, and commodities. However, you must account for specific nuances, such as varying liquidity levels and trading hours, which differ across each asset class.
3. Why do technical indicators sometimes provide false signals?
Indicators are “lagging,” meaning they calculate past data. In choppy, sideways markets, indicators like moving averages or RSI can produce “whipsaws” or false signals. This is why it is vital to use them as confirmation tools rather than standalone entry triggers.