
A platform built to celebrate creativity nearly lost its edge because it could not read its own numbers fast enough.
That was the position the Redbubble business model found itself in as its catalog swelled into millions of designs and its customer base spread across dozens of countries. Sales data, artist information, and shipping records sat in separate systems that rarely talked to each other.
Marketing teams guessed at what customers wanted instead of knowing. Support staff pieced together order histories by hand. What began as a scrappy, artist-friendly online marketplace had outgrown the tools meant to manage it, and the mismatch showed up in slower campaigns, patchier retention, and rising operational strain.
This case study looks at how the creative marketplace rebuilt its data foundation and turned that fix into real gains across marketing, customer retention, operations, and risk management. Before getting into the turnaround, here are the basics on the company itself:
At a Glance:
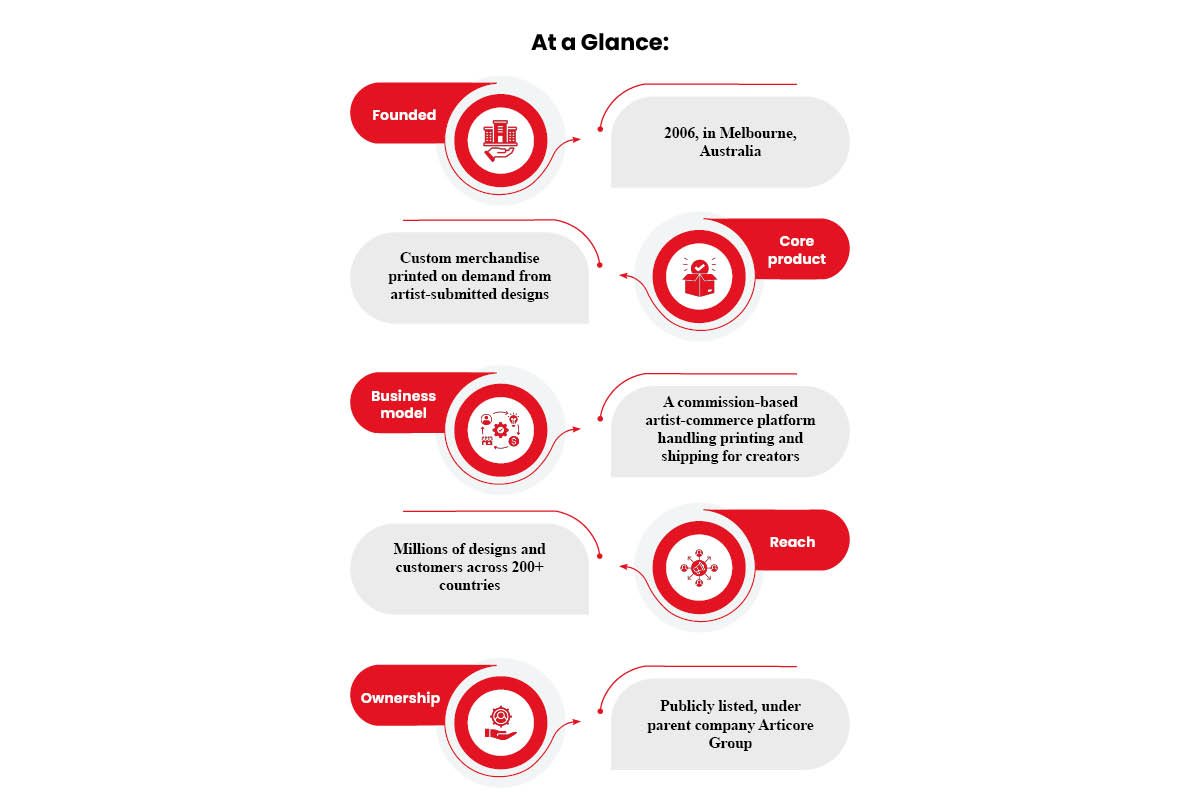
- Founded: 2006, in Melbourne, Australia
- Core product: Custom merchandise printed on demand from artist-submitted designs
- Business model: A commission-based artist-commerce platform handling printing and shipping for creators
- Reach: Millions of designs and customers across 200+ countries
- Ownership: Publicly listed, under parent company Articore Group
The Cost of Scattered Data
More information should have made decisions easier. Instead, it slowed everything down. The Redbubble business model connects independent artists with buyers across dozens of countries, and that structure alone generates constant streams of sales, product, marketing, legal, and finance data. The real issue was not a shortage of numbers.
It was volume without order. Employees pulled figures into spreadsheets and rebuilt pivot tables by hand just to see basic trends. Information sat scattered across separate systems, so teams struggled to link cause and effect. Eventually, staff spent more hours organizing data than acting on it.
A Business Moving Faster than Its Answers
The scattered data problem soon became a bigger issue: the business itself was moving faster than its own decision-making. Departments could see their own numbers but had little visibility into anyone else’s. Spreadsheets slowed analysis instead of speeding it up, and teams struggled to connect one figure to another.
That gap left room for guesswork to replace evidence. Running the Redbubble business model across so many moving parts meant leadership needed one shared picture of the company, not several disconnected ones.
The Fragmented View:
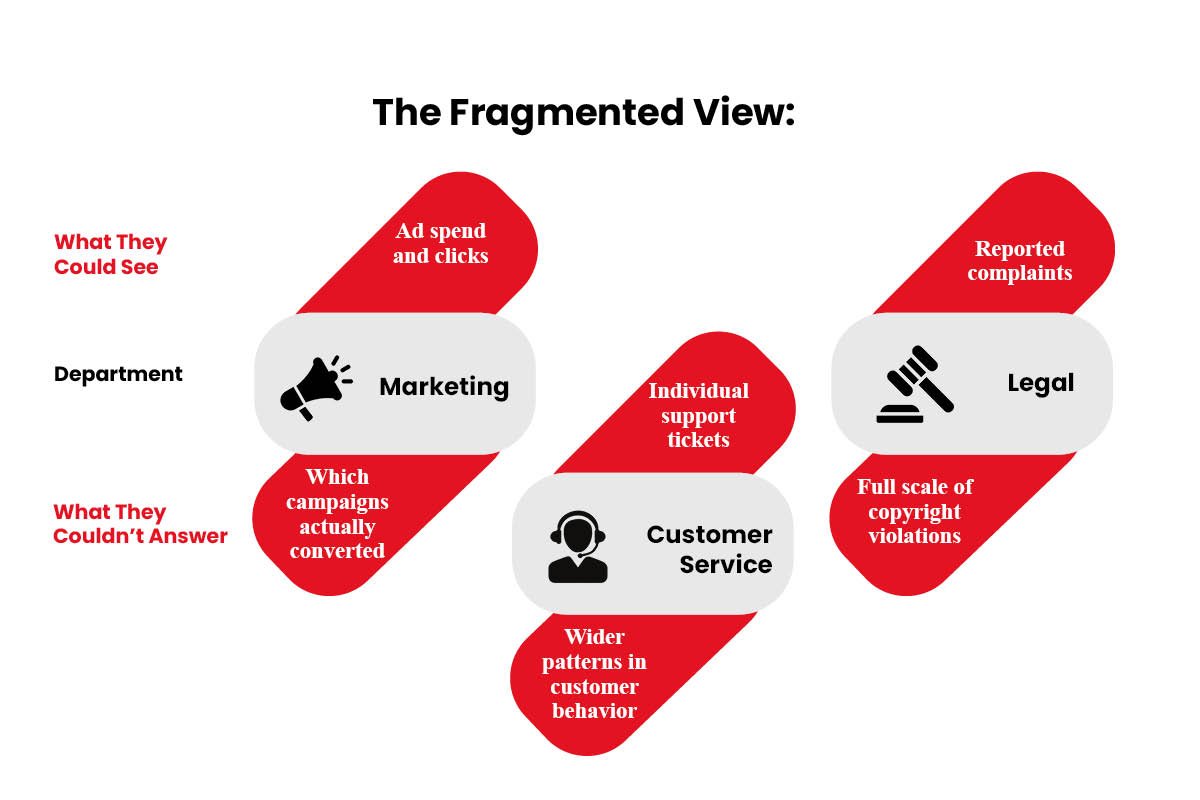
| Department | What They Could See | What They Couldn’t Answer |
| Marketing | Ad spend and clicks | Which campaigns actually converted |
| Customer Service | Individual support tickets | Wider patterns in customer behavior |
| Legal | Reported complaints | Full scale of copyright violations |
Each team had a piece of the puzzle. No one had the whole picture.
The Turning Point: Choosing One Truth
Rather than build new infrastructure or hire a large technical team, the company looked for a cloud-based analytics solution built for scale. It picked GoodData for its ability to pull scattered data into one place and its simple setup. A digital marketplace running on the Redbubble business model needed a system that could match its many data streams without adding complexity.
Rollout in Stages:
- Week 1-2: Requirements defined, self-service platform launched
- Phase 1: Operations team onboarded first
- Phase 2: Sales and marketing added next
- Result: Six separate data sources combined into one working system
The staged rollout let teams adjust as usage grew, instead of forcing change all at once.
The Recovery Plan: Put Data Into Everyday Decisions
Access to unified data meant little until teams actually used it to work differently. The real test of the Redbubble business model was whether the new system changed daily habits across departments, not just dashboards.

- Sales and Marketing
- Reports tracked sales trends by product and country. Marketing reviewed email, SEM, coupons, and customer lifecycle data, and found the first three months after purchase to be the key window for keeping customers.
- Customer Service
- Support data was matched against NPS scores. Complaints were sorted by region, which exposed shipping problems with one provider that the company then fixed.
- Legal
- Copyright violations became easier to track, lowering risk and supporting compliance.
- Finance
- Regular reporting gave finance a clearer read on performance and resource needs.
Five departments running on one system, not five separate projects.
The Results: From “I Think” to “I Know”
The numbers tell a clear before-and-after story.
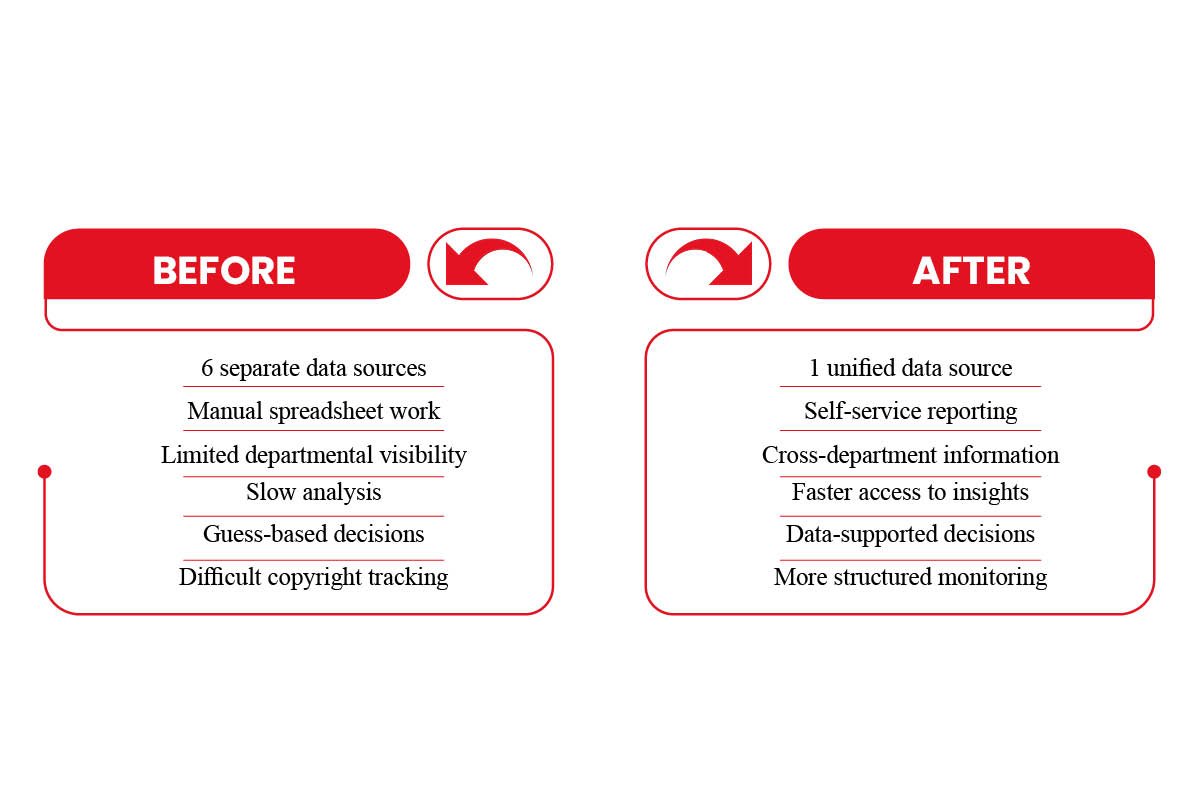
| Before | After |
| 6 separate data sources | 1 unified data source |
| Manual spreadsheet work | Self-service reporting |
| Limited departmental visibility | Cross-department information |
| Slow analysis | Faster access to insights |
| Guess-based decisions | Data-supported decisions |
| Difficult copyright tracking | More structured monitoring |
Self-service reporting launched within two weeks of setting requirements. More than 5 departments adopted the system, and over 60 accounts were created across teams. More than a quarter of the organization began using analytics for important decisions.
For a company built on the Redbubble business model, where thin margins and constant transactions leave little room for guesswork, that shift showed up directly in operational efficiency, customer retention, and marketing performance.
When Decisions Turned Into an Advantage
The bigger story here goes past software. It is about what clear data did for the business itself.
4 Areas, 1 Shift:
- Customer Retention: Key moments in the buyer’s journey became visible, so retention problems could be caught and addressed early.
- Marketing Efficiency: Campaign performance became measurable, letting teams see which efforts actually paid off.
- Operational Control: Matching complaints against satisfaction scores helped pinpoint exact service gaps.
- Risk Management: Legal teams gained a more systematic way to monitor copyright issues.
The strongest sign of change sits in one number: over a quarter of employees running the Redbubble business model now use analytics for critical decisions, not as a side tool, but as part of how the company runs day to day.
The Second Act: Same Lesson, Modern Marketing

The lesson resurfaced years later in marketing measurement. Working with Fospha, Redbubble moved past click-based tracking toward full-funnel measurement, and the results echoed the earlier data crisis: numbers had been hiding the truth. Paid Social was delivering 10X higher ROAS than previous reporting showed, and Pinterest was undervalued by 18X.
Backed by that evidence, spending on Pinterest doubled, TikTok’s channel ROAS improved more than 2X year over year, and Pinterest held the lowest customer acquisition cost among paid channels by January 2025. Running the Redbubble business model profitably still comes down to one thing: measuring the right numbers before spending against them.
Read More:
- Cooking Up Comfort: Why General Mills Is Everyone’s Favorite Kitchen Helper
- The Rise of Penfolds Wine: From Australian Vineyards to Global Fame
Final Verdict: A Shift in Decision-Making
Technology was not the real fix. The crisis began when growth outpaced the company’s ability to read its own information, and recovery began only when that information became accessible and useful to people making daily calls. That distinction matters most for a marketplace generating constant activity across thousands of products, artists, customers, and marketing touchpoints.
Running the Redbubble business model at scale means data never stops flowing. The lesson stands clear: growth adds value only when a company can actually understand what that growth is telling it.