In the era of stock trading, to accurately predict the market fluctuations is of supreme importance for the financial success. Traders are completely dependent on on chart patters to analyze the stocks and predict the future movements. By studying the stock chart patterns, traders observe and learn the how stock prices moves in a particular direction.
To master the interpretation of these stock patters, traders are required to get the insights to make well informed decisions and capitalize on the market opportunities.
What Are Stock Chart Patterns?
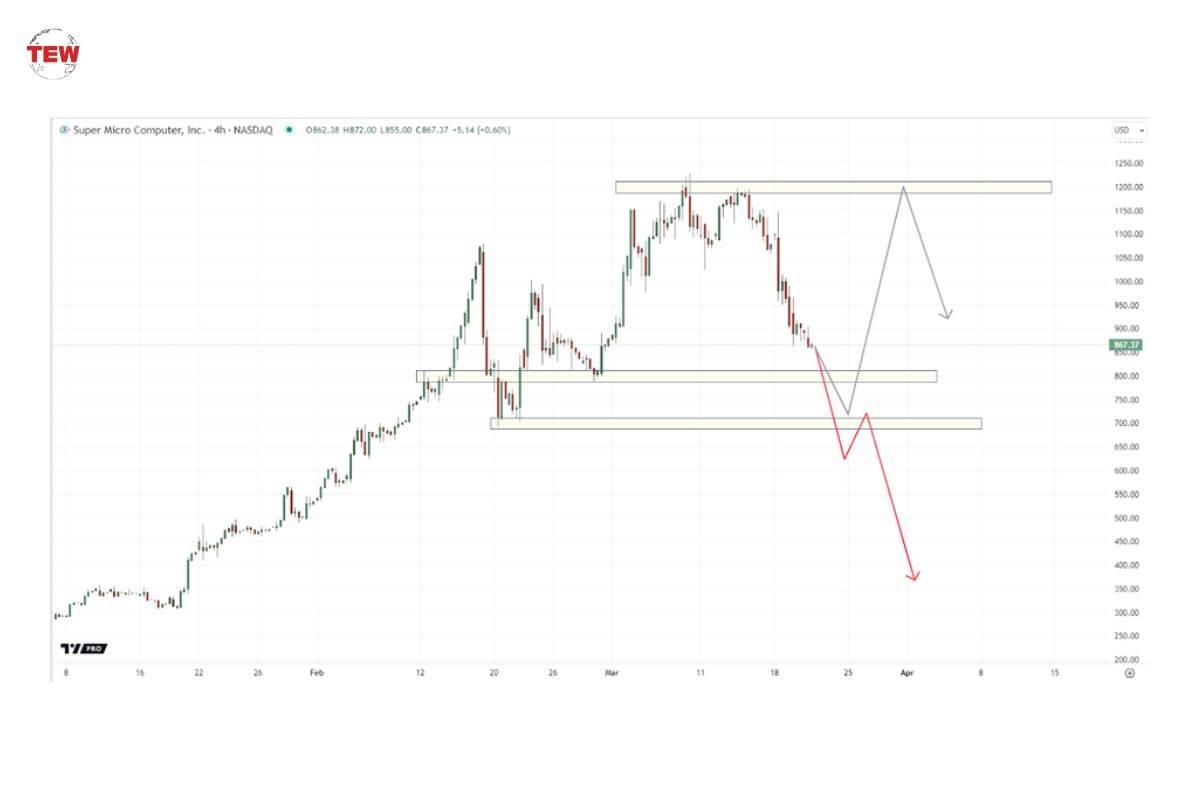
In simple terms, stock chart patterns gives the valuable indicators of potential shifts in the market trends.These patters comes out from the patterns of price movements over time and forms a recognizable configuration on price charts. When the price pattern gives a signal change in trend direction, it is called as reversal pattern and when the trend goes in the existing direction after a small pause, it is called as continuous pattern. If we talk about the Johannesburg Stock Exchange (JSE), the performance of the JSE All Share price index is often used as a benchmark to measure the health and direction of the South African economy.
Patterns are concisely recognized by connected common price points like highs,lows or closing prices for a particular period. These price points varies in complexities from a very simple trendline to more difficult formations like double head-and-shoulders patterns. With the help of learning and evaluating these patterns, traders get to know when to buy, sell or hold the positions in the stock market. To have an expertise in the recognition and analysis of the stock market, it is essential for the traders to go through the dynamics of stock market in an effective manner.
The Role of Trendlines in Technical Analysis

As we already know that price patterns are easily recognized by using the series of lines and curves. It is quite important to understand the trendlines. These trendlines helps the traders or tehnical analysts to find the support and resistance areas on the price chart. Trendlines are created in such a way that lead to connect a series of descending peaks or ascending troughs.
A trendline goes upwards when the price movements are creating higher highs and lower lows. This line is drawn on the price chart by connecting to the rising lows whereas a downward trendline moves downwards and creates when the price movement is making lower highs and lower lows.
Common Stock Chart Patterns
Among the various patters that the traders use, following are some of the popular and widespread for its usage.
- Channels and Rectangles: These are the type of pattern that are continuous in nature and marks a pause before the previous trend resumes. When looking from the perspective of technical analyst, a rectangle price formation on the chart is usually signal of this pause

- Cup with Handle: The bullish flag pattern which is a continuation pattern oftenly shown when a market is going upward. It represents a period of consolidation that is followed by a major upward price movement.
- Head and Shoulders: This is one of the versatile technical analysis formation that can act both as a bullish and bearish reversal pattern on the basis of structure within the context of the market.
- Rounded Tops and Bottoms: These patters weighs a potential turn in the ongoing trend. It signals a reversal from the bullish to a earish trend or vice versa.
The Potential of Stock Chart Patterns
If we talk about the chart patterns, these are not just some random shapes drawn on a graph, it incorporates the collective mindset of the market. The researchers claim that they ccan predict the prices of future stocks by analyzing the past patterns. The principle behind these chart patterns is simple yet absolute. The traders with the help of these insights can make clean and informed decisions about holding, buying, or selling stocks.
In the fast paced world of stock trading, chart patterns works as a guide to make well informed decisions. The drive the traders through the uncertainities of the market. In order to get to know about these stock chart patterns, traders make comprehend decisions and maximizing the potential gains whereas minimizing the risks. Understanding the behavior is key to success. With continuous and consistent pracctice, traders can garner the power of hart pattern to go through the dynamic stock market landscape in an effective manner.
Wrapping Up
In conclusion, one can say that by mastering the art of chart pattern analysis provides the traders with invaluable insights into the market trends and price movements.In order to understand the psyche behind the stock chart patterns and their historial significance, traders can make well informed decisions in the world of stock trading. However, it should be noted that this is only one tool in the arena of traders and they should use other tols and risk management strategies in order to minimize the risk. With continuous efforts and practice, traders can easily grab the power of chart patterns to go through the complexities of stock market with more confidence and success.