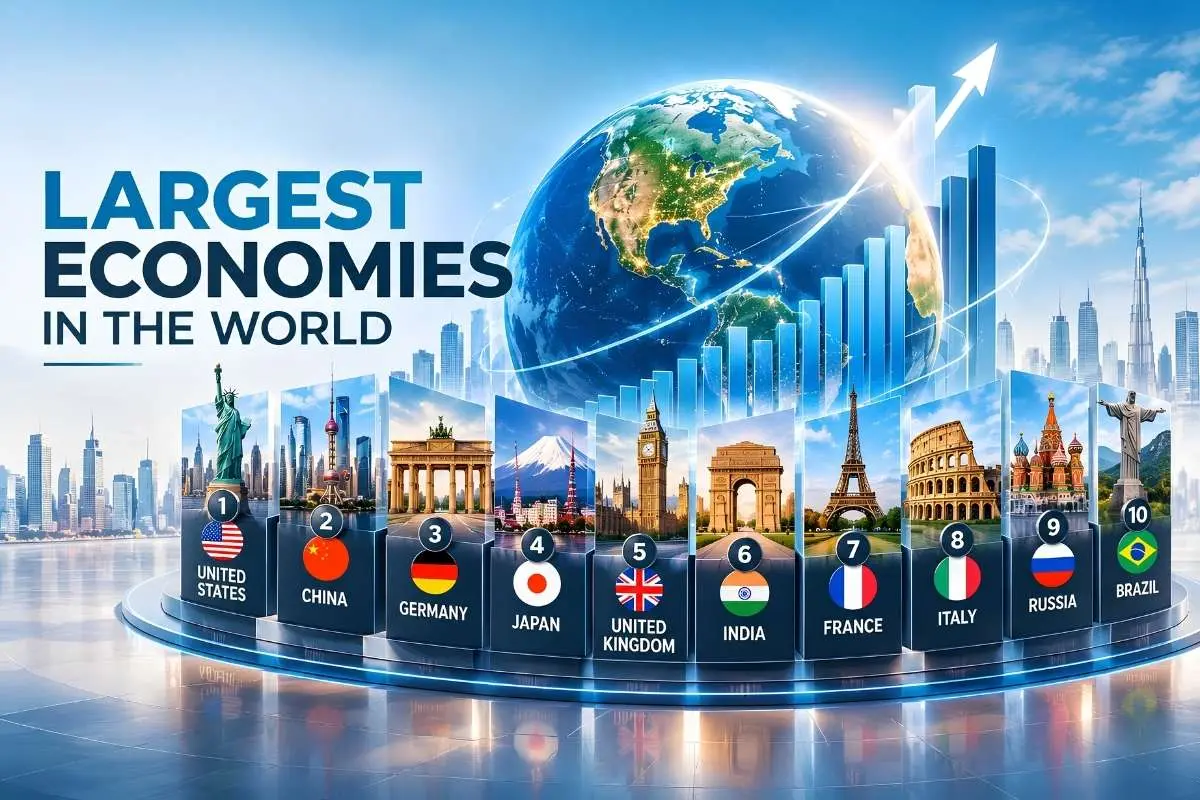
The United States, China, Germany, Japan, and the United Kingdom are the five largest economies in the world by nominal GDP in 2026, with India ranking sixth. The IMF’s 2026 projections show how widely economic size varies across major markets, while growth rates reveal a different picture, with some economies expanding much faster than others.
But what makes an economy large? Is it population, productivity, industrial strength, consumer spending, trade, or a combination of these factors?
This article ranks the largest economies in the world using 2026 IMF projections. Here is how the 20 largest economies rank and what sets each one apart.
How Do We Measure the Size of an Economy?
GDP, or gross domestic product, measures the total value of goods and services produced in a country over a specific period. It can be measured by looking at what an economy produces, what people and businesses spend, or the income generated from that activity.
For this ranking, we use nominal GDP in U.S. dollars as the main measure. This means the 20 economies are ranked by the value of their GDP converted into U.S. dollars using market exchange rates. The 2026 figures are based on the IMF’s World Economic Outlook data.
What Is Nominal GDP?
Nominal GDP measures a country’s economic output. It is widely used to compare the financial size of economies and is useful for understanding their position in global trade, investment, and financial markets.
What Is GDP at Purchasing Power Parity?
GDP at PPP adjusts for differences in prices between countries. For example, ₹1,000 can buy more goods and services in India than the same amount converted at market exchange rates might suggest.
As a result, countries with lower local prices can have a much larger GDP when measured using PPP.
What Are the 20 Largest Economies in the World in 2026?
The IMF’s 2026 projections place the United States first by nominal GDP, followed by China and Germany. India ranks sixth, while Russia and Brazil remain among the world’s 10 largest economies.
| Rank | Economy | Nominal GDP | GDP at PPP | Real GDP Growth |
| 1 | United States | $32.38T | $32.38T | 2.3% |
| 2 | China | $20.85T | $44.30T | 4.4% |
| 3 | Germany | $5.45T | $6.41T | 0.8% |
| 4 | Japan | $4.38T | $7.26T | 0.7% |
| 5 | United Kingdom | $4.26T | $4.72T | 0.8% |
| 6 | India | $4.15T | $18.90T | 6.5% |
| 7 | France | $3.60T | $4.73T | 0.9% |
| 8 | Italy | $2.74T | $3.87T | 0.5% |
| 9 | Russia | $2.66T | $7.53T | 1.1% |
| 10 | Brazil | $2.64T | $5.23T | 1.9% |
| 11 | Canada | $2.51T | $2.91T | 1.5% |
| 12 | Australia | $2.12T | $2.10T | 2.0% |
| 13 | Mexico | $2.12T | $3.58T | 1.6% |
| 14 | Spain | $2.09T | $2.98T | 2.1% |
| 15 | South Korea | $1.93T | $3.54T | 1.9% |
| 16 | Türkiye | $1.64T | $4.03T | 3.4% |
| 17 | Indonesia | $1.54T | $5.45T | 5.0% |
| 18 | Netherlands | $1.45T | $1.59T | 1.2% |
| 19 | Saudi Arabia | $1.39T | $2.89T | 3.1% |
| 20 | Switzerland | $1.15T | $0.96T | 1.3% |
(Note: Figures are 2026 IMF WEO projections and may change as new estimates and national data are released. Growth figures refer to real GDP growth.)
Detailed Economic Profiles of the Largest Economies in the World:
1. United States
- GDP (Nominal): $32.38 trillion
- GDP per Capita: $94,430
- Global Trade Role: Major goods and services trader
The U.S. economy benefits from the scale of its domestic market as well as its deep capital markets. Its businesses also have a strong presence in global technology, finance, healthcare, entertainment, and professional services.
2. China
- GDP (Nominal): $20.85 trillion
- GDP per Capita: $14,874
- Global Trade Role: Major exporter and manufacturing center
China’s economic size is closely tied to its manufacturing capacity and position in global supply chains. Its place among the largest economies in the world reflects the scale of its industrial base, while its PPP GDP is more than twice its nominal GDP in the 2026 projections, showing how much its economic scale changes when local price differences are taken into account.
3. Germany
- GDP (Nominal): $5.45 trillion
- GDP per Capita: $65,303
- Global Trade Role: Major industrial exporter
Germany remains highly dependent on international trade. In 2025, it exported €1.56 trillion in goods and recorded a €200.5 billion trade surplus, reflecting the scale of its export-oriented economy.
4. Japan
- GDP (Nominal): $4.38 trillion
- GDP per Capita: $35,703
- Global Trade Role: Advanced manufacturing exporter
Japan’s economic importance comes from its long-established industrial base rather than rapid population growth. Its companies remain deeply involved in automobiles, machinery, electronics, chemicals, and other high-value manufacturing, while the country continues to operate as a major exporter.
5. United Kingdom
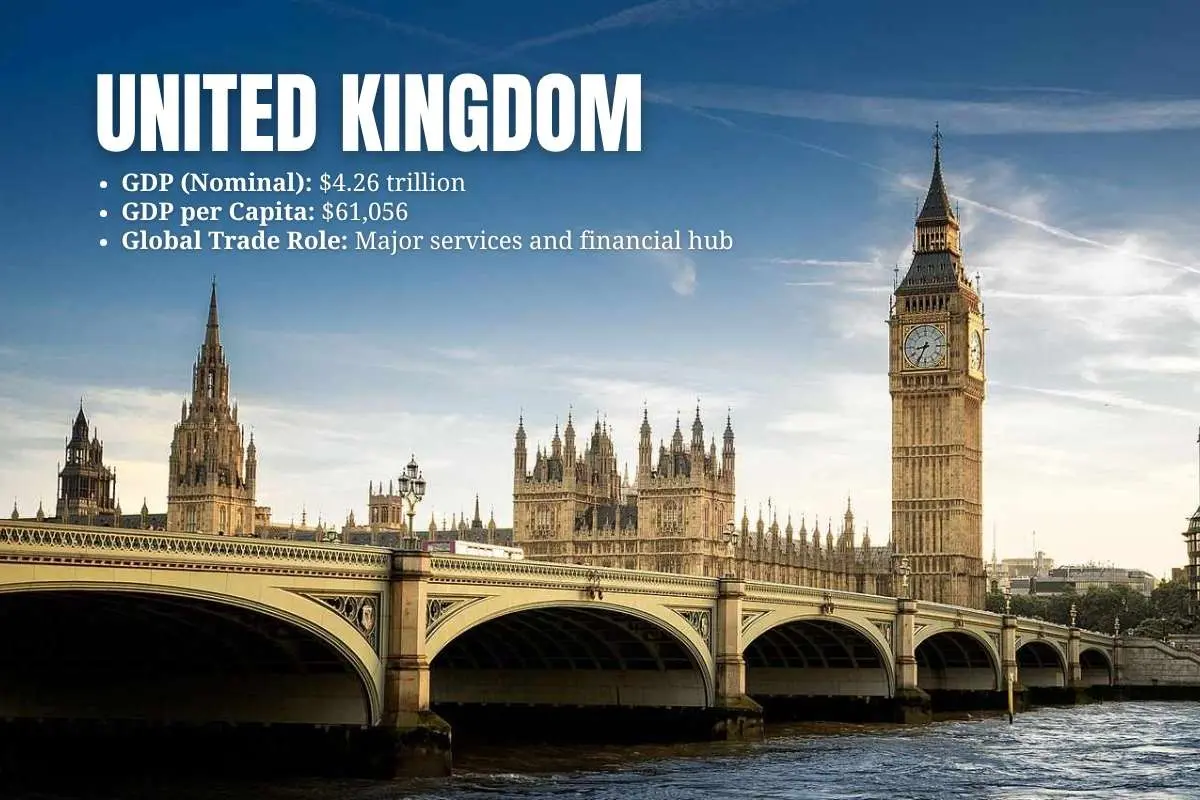
- GDP (Nominal): $4.26 trillion
- GDP per Capita: $61,056
- Global Trade Role: Major services and financial hub
The UK’s economic role extends beyond the size of its domestic market. Financial services, professional services, education, technology, and other internationally traded services connect the country to businesses and investors around the world.
6. India
- GDP (Nominal): $4.15 trillion
- GDP per Capita: $2,813
- Global Trade Role: Major services and goods exporter
India’s growth is being supported by both domestic demand and services exports. The World Bank reported that India’s economy grew 6.5% in FY2024–25, with private consumption strengthening and service exports, particularly software and business services, supporting export growth.
The contrast between India’s nominal and PPP GDP is also significant. Its PPP economy is much larger because many goods and services cost less domestically than in high-income economies.
7. France
- GDP (Nominal): $3.60 trillion
- GDP per Capita: $52,083
- Global Trade Role: Major European exporter
France has a diverse economic base that goes well beyond tourism. Aerospace, transport equipment, pharmaceuticals, luxury goods, food products, and business services give the country several internationally competitive industries.
8. Italy
- GDP (Nominal): $2.74 trillion
- GDP per Capita: $46,505
- Global Trade Role: Export-oriented industrial economy
Italy has a broad base of manufacturing businesses, particularly in machinery, transport equipment, consumer goods, fashion, food, and other specialized products.
Its 2026 growth projection of 0.5% places it among the slower-growing economies in the top 20.
9. Russia
- GDP (Nominal): $2.66 trillion
- GDP per Capita: $18,525
- Global Trade Role: Major energy and commodity exporter
Russia’s economy remains strongly tied to commodity exports. It recorded $492.3 billion in merchandise exports against $293.5 billion in imports, giving it a $198.8 billion trade surplus in the latest WITS data. Its large export base helps explain the country’s strong position in global commodity trade.
10. Brazil
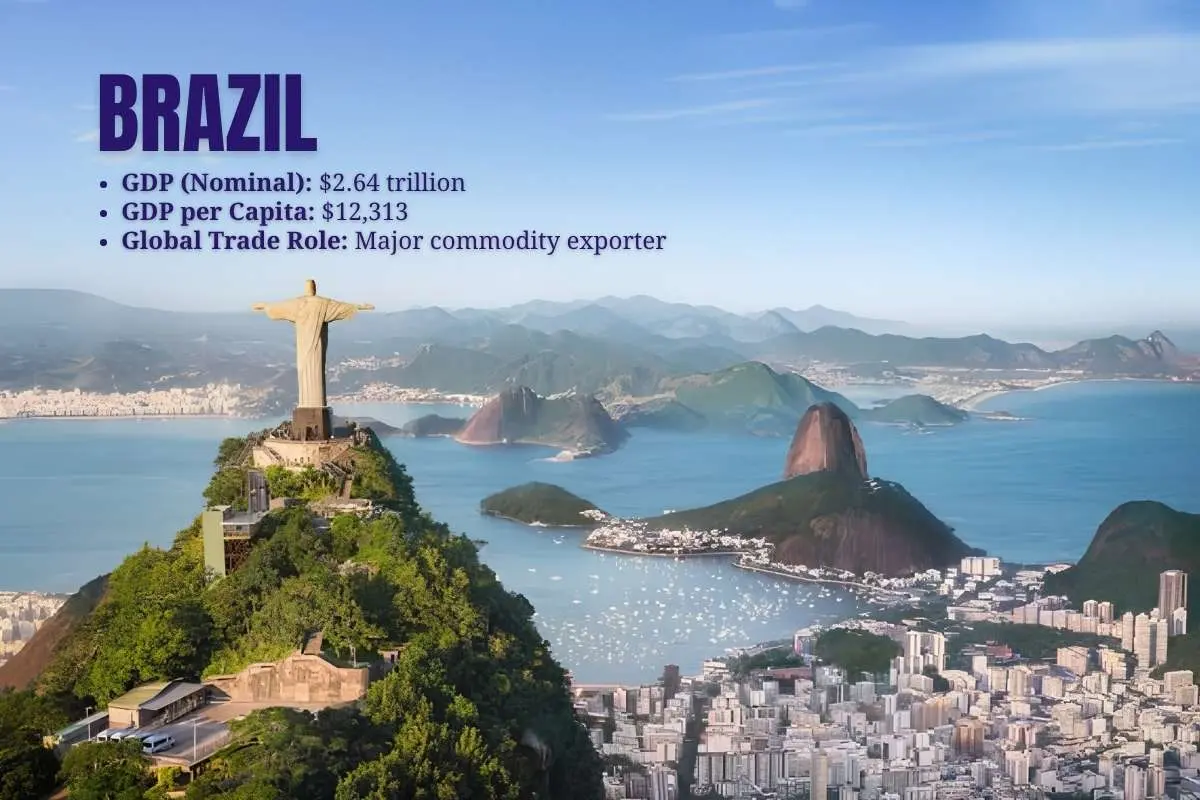
- GDP (Nominal): $2.64 trillion
- GDP per Capita: $12,313
- Global Trade Role: Major commodity exporter
Agriculture has an unusually important role in Brazil’s international trade. A 2025 World Bank study estimated that agriculture alone accounts for about 8.4% of Brazil’s GDP, 16.2% of employment, and 40% of total exports.
At the same time, Brazil’s large domestic market means its economy is not dependent on exports alone. The World Bank identifies private consumption, services, and agriculture as major contributors to recent growth.
11. Canada
- GDP (Nominal): $2.51 trillion
- GDP per Capita: $60,305
- Global Trade Role: Major North American trading economy
Canada combines a high-income services economy with extensive natural resources. Energy, minerals, forestry, agriculture, and manufacturing give the country an important role in North American and global supply chains.
Its economic relationship with the United States is particularly important because of the scale of cross-border trade and integrated production.
12. Australia
- GDP (Nominal): $2.12 trillion
- GDP per Capita: $75,648
- Global Trade Role: Major resource exporter
Australia’s natural resources give it an important position in global commodity markets. Iron ore, coal, natural gas, and other minerals connect its economy closely with major Asian buyers, while services remain important to domestic economic activity.
13. Mexico
- GDP (Nominal): $2.12 trillion
- GDP per Capita: $15,779
- Global Trade Role: Major North American manufacturer
Mexico’s economic importance is closely tied to its integration with the U.S. market. U.S. goods and services trade with Mexico reached an estimated $964.1 billion in 2025, with goods trade accounting for $871.6 billion.
14. Spain
- GDP (Nominal): $2.09 trillion
- GDP per Capita: $41,563
- Global Trade Role: Major European services economy
Spain’s economy has a large services base, with tourism playing an important role alongside retail, transport, financial services, and business activity. Its 2.1% projected growth for 2026 is also relatively strong among the large European economies in this ranking.
15. South Korea
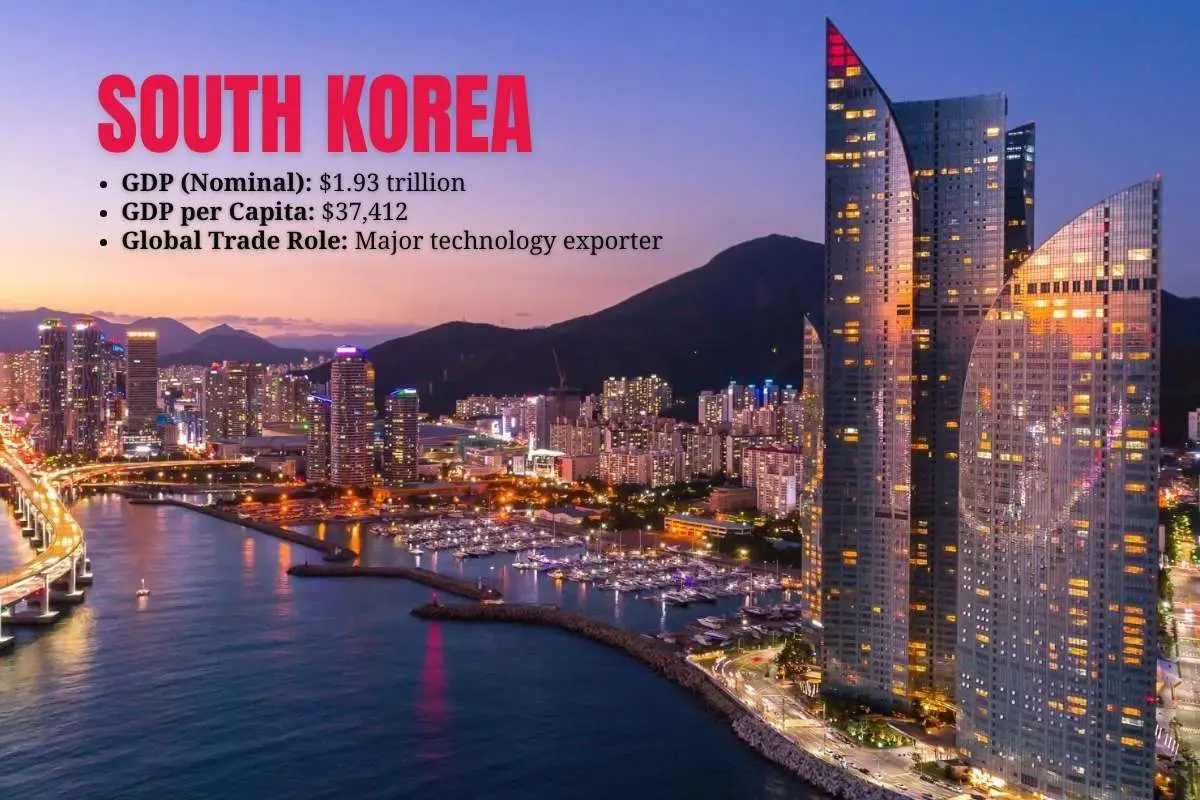
- GDP (Nominal): $1.93 trillion
- GDP per Capita: $37,412
- Global Trade Role: Major technology exporter
South Korea’s global economic role is strongly linked to advanced manufacturing and technology exports. Semiconductors, electronics, automobiles, batteries, and chemicals connect its companies to supply chains across Asia, North America, and Europe, helping South Korea maintain its place among the largest economies in the world.
16. Türkiye
- GDP (Nominal): $1.64 trillion
- GDP per Capita: $19,018
- Global Trade Role: Regional manufacturing and trade hub
Türkiye’s location gives it an unusual advantage: it sits between major European, Asian, and Middle Eastern markets. Its export base includes manufactured goods, vehicles, machinery, textiles, food products, and services. World Bank trade data also shows services exports of more than $106 billion in the latest available data.
17. Indonesia
- GDP (Nominal): $1.54 trillion
- GDP per Capita: $5,362
- Global Trade Role: Major Southeast Asian exporter
Indonesia’s large population gives it a major domestic consumer base, while its natural resources add significant export strength. Its 5.0% projected growth in 2026 also places it among the fastest-growing economies in the top 20.
The gap between its nominal GDP and PPP GDP is another reminder that its economic activity is considerably larger when local price levels are taken into account.
18. Netherlands
- GDP (Nominal): $1.45 trillion
- GDP per Capita: $79,918
- Global Trade Role: European trade gateway
The Netherlands has a relatively small population compared with most economies on this list, yet it generates a large amount of economic activity. Its location, transport infrastructure, logistics networks, and connections to European markets help make international trade a major part of its economy.
19. Saudi Arabia
- GDP (Nominal): $1.39 trillion
- GDP per Capita: $37,811
- Global Trade Role: Major energy exporter
Oil remains central to Saudi Arabia’s economic position, but the country’s economic story increasingly includes investment and non-oil activities. The IMF projects 3.1% real GDP growth for 2026, placing Saudi Arabia above several larger European economies in this ranking.
20. Switzerland
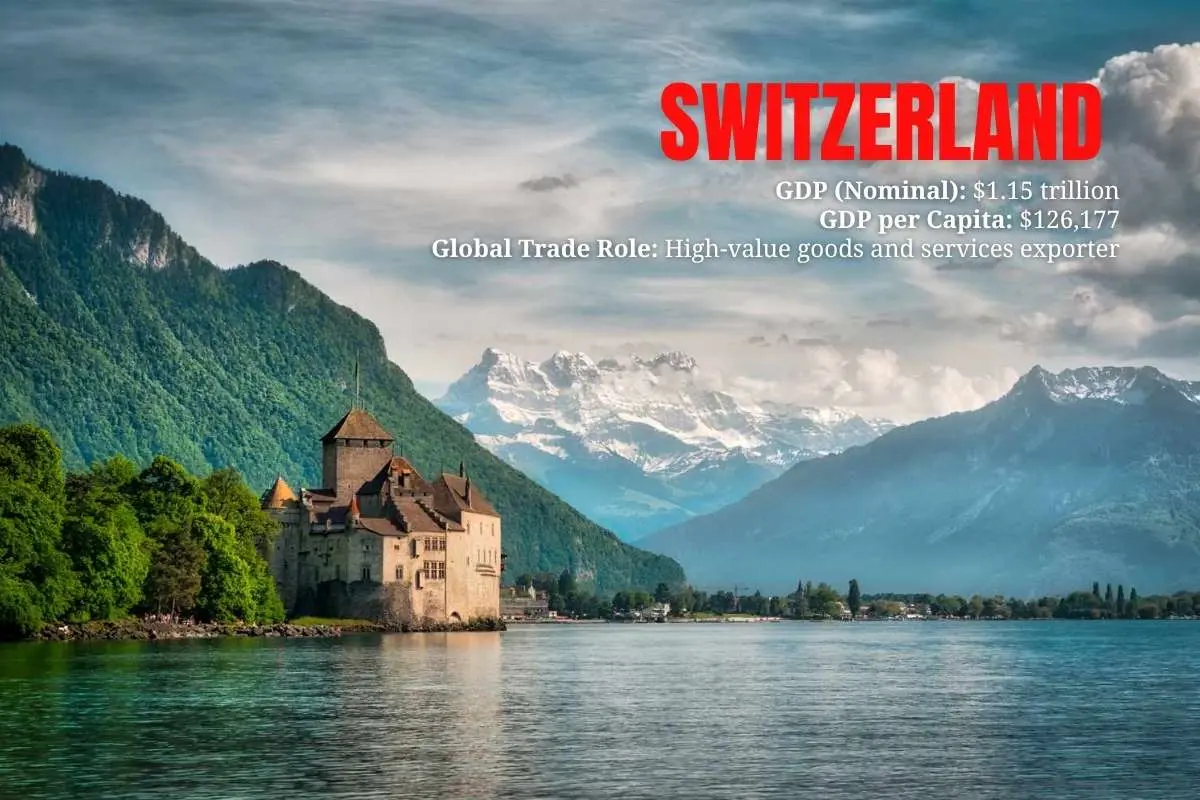
- GDP (Nominal): $1.15 trillion
- GDP per Capita: $126,177
- Global Trade Role: High-value goods and services exporter
Switzerland shows why total GDP should not be confused with economic output per person. Its economy is much smaller in total than those of the United States, China, or Germany, but its projected GDP per capita is above $126,000.
Its economic model is built around high-value activities, including pharmaceuticals, precision manufacturing, financial services, and other specialized industries.
Which Major Economies Are Growing Fastest in 2026?
Economic size and economic growth are two different measures. A large economy can grow slowly because of its size, while a smaller economy can expand much faster.
Among the 20 largest economies in the world, India has the highest projected real GDP growth at 6.5%, followed by Indonesia at 5.0%, China at 4.4%, Türkiye at 3.4%, and Saudi Arabia at 3.1%.
The United States is projected to grow 2.3%, while Germany, Japan, and the United Kingdom are each below 1%. This shows why rankings based only on GDP size do not explain the full economic picture.
Fastest-Growing Major Economies in 2026:
| Economy | 2026 Real GDP Growth |
| India | 6.5% |
| Indonesia | 5.0% |
| China | 4.4% |
| Türkiye | 3.4% |
| Saudi Arabia | 3.1% |
| United States | 2.3% |
| Spain | 2.1% |
| Australia | 2.0% |
(Note: These figures are IMF projections, not final growth results.)
Which Are the Largest Economies in the World by Region?
The global rankings become easier to understand when viewed by region.
- North America: United States
- Asia: China
- Europe: Germany
- South America: Brazil
- Africa: Nigeria
- Oceania: Australia
Regional comparisons can change depending on whether nominal GDP or PPP GDP is used. The same country may hold a different position under each measure because PPP adjusts for local price differences.
What Makes an Economy Large?
The largest economies in the world tend to combine several factors:
- Large population: Creates a bigger workforce and consumer market.
- High productivity: Allows workers and businesses to generate more economic output.
- Investment: Spending on infrastructure, technology, skills, and businesses expands productive capacity.
- Strong industries: Manufacturing, services, technology, energy, and other major sectors add to GDP.
- Trade and capital: Global trade, investment, and financial systems can expand economic activity.
- Institutions: Stable rules and effective institutions support businesses and long-term investment.
How Have the Largest Economies in the World Changed Since 2000?
The global economic order has changed significantly since the start of the century.
China’s rise has been one of the biggest changes. Its manufacturing base, investment, exports, and growing domestic market helped it move from a much smaller economy in 2000 to the world’s second-largest economy by nominal GDP.
India has also moved sharply higher over the same period. Its large domestic market, services sector, investment, and expanding industrial base have supported rapid economic growth.
Meanwhile, several mature economies continue to hold large positions because of their high productivity, financial systems, advanced industries, and established trade networks.
The important point is that economic rankings are not permanent. Exchange rates, productivity, demographics, inflation, investment, commodity prices, and policy changes can all affect a country’s position.
What Does the 2026 Global Economic Outlook Look Like?
The IMF’s April 2026 World Economic Outlook projects global real GDP growth of 3.1% in 2026 and 3.2% in 2027, assuming the conflict in the Middle East remains limited in duration and scope.
The outlook also points to higher global inflation in 2026 before inflation resumes its decline in 2027. The IMF identifies geopolitical conflict, trade tensions, financial conditions, and weaker-than-expected productivity gains as important downside risks.
For businesses, this means economic size alone is not enough to assess a market. Companies also need to consider growth, consumer demand, inflation, exchange rates, trade exposure, demographics, and investment conditions.
Conclusion
The largest economies in the world reflect a mix of market size, productivity, investment, trade, technology, and consumer demand. The 2026 ranking also shows why GDP alone does not tell the full story, as economies differ widely in growth, purchasing power, and GDP per capita.
For businesses and investors, the key is to look beyond the ranking and understand what is driving each economy and how quickly it is changing.
FAQs
1. Which country has the highest GDP per capita among major economies?
Luxembourg, Ireland, and Switzerland rank among the countries with the highest GDP per capita, although small economies can rank very differently from the largest economies in the world by total GDP.
2. Can a country have a large GDP but a low standard of living?
Yes. A large total GDP can result from a large population, while GDP per capita may remain relatively low.
3. How often do global GDP rankings change?
They can change each year as GDP estimates, exchange rates, inflation, population, and economic growth rates change.
4. Why can a country’s GDP ranking fall even when its economy grows?
A country can grow in real terms but fall in the ranking if another economy grows faster or currency movements reduce its GDP when converted into U.S. dollars.
5. Does a larger GDP mean a country is wealthier?
Not necessarily. Total GDP measures economic output, while GDP per capita provides more context about output relative to population.
Source:
- https://www.imf.org/en/publications/weo/issues/2026/04/14/world-economic-outlook-april-2026
- https://databank.worldbank.org/source/world-development-indicators
- https://www.investopedia.com/terms/n/nominalgdp.asp
- https://www.imf.org/en/publications/fandd/issues/series/back-to-basics/purchasing-power-parity-ppp
- https://www.imf.org/en/home
- https://www.bea.gov/news/2025/gross-domestic-product-2nd-quarter-2025-third-estimate-gdp-industry-corporate-profits
- https://www.china-briefing.com/news/china-manufacturing-industry-tracker-2024-25/
- https://www.destatis.de/EN/Home/_node.html
- https://www.thecityuk.com/our-work/
- https://www.investopedia.com/insights/worlds-top-economies/
- https://www.paih.gov.pl/en/