The air we breathe is a silent killer: over 8 million premature deaths occur each year. Did you know 99% of the world’s population is exposed to air pollution? The levels are above WHO limits. The dirtiest countries in the world must be examined. Because of this startling health risk. But the term refers to much more than just smog.
This ranking extends beyond PM2.5, or fine particulate matter. It employs a thorough, multi-metric “Dirty Score” that also evaluates basic sanitation/hygiene, waste management systems, and safely managed water access as threats to public health. 3 Pollution directly affects human health and the global Sustainable Development Goals (SDGs), and the ultimate indicator of a nation’s environmental status is not only its contribution to global climate change (like CO2), but also the immediate, local burden of disease on its citizens.
How We Define “Dirtiest” – Ranking Methodology
The definition of “dirtiest” must be multi-metric to provide a fair and complete global picture, moving beyond the sensational focus on air quality alone.
We synthesize data across four critical dimensions:
- Air Quality (PM2.5, PM10): Measuring fine particulate matter concentration. This is the most common metric for direct health impacts.
- Water Quality & Access: Assessing the availability of safe, managed drinking water and the prevalence of unsafe water sources.
- Waste Management: Evaluating the efficiency of solid waste containment and disposal versus reliance on polluting open dumps.
- Hygiene & Sanitation: Tracking access to basic sanitation facilities, a frontline defense against infectious disease.
This multi-metric approach shows that a nation with moderate air pollution can still have a high disease burden because of inadequate water and sanitation. The average citizen’s exposure to environmental health risks is more accurately reflected in this comprehensive score.
You Won’t Believe These Are the Top 15 Dirtiest Countries in the World:
Here are the top 15 nations that face the highest immediate environmental health risks. They are judged not just by polluted air. But by the critical failure of their water, waste, and sanitation systems.
| Rank | Country | Air Quality (PM2.5 Conc. approx. µg/m3) | Water Quality & Sanitation Access | EH Score / Dirty Score (Worst = Low Score) |
| 15 | Bahrain | High (>35 µg/m3) | Moderate access, high water stress | Medium-Low |
| 14 | Kuwait | High (>34 µg/m3) | High water stress, 99% desalination | Medium-Low |
| 13 | Cameroon | High (>38 µg/m3) | Poor sanitation, low safe water access | Low |
| 12 | Mongolia | Extreme (Winter Peak >100 µg/m3) | Moderate, localized contamination | Low |
| 11 | Qatar | High (>33 µg/m3) | High reliance on desalination, water stress | Medium-Low |
| 10 | DR Congo | High (>39 µg/m3) | Critical (High lack of safe water access) | Very Low |
| 9 | Egypt | High (>40 µg/m3) | Contamination from industrial waste | Very Low |
| 8 | Nepal | Extreme (>42 µg/m3) | Poor urban waste management | Very Low |
| 7 | UAE | High (>34 µg/m3) | Moderate access, regional dust impact | Medium-Low |
| 6 | Iraq | High (>44 µg/m3) | Critical water scarcity, infrastructure damage | Very Low |
| 5 | Burkina Faso | High (>42 µg/m3) | Critical lack of sanitation/water | Very Low |
| 4 | Tajikistan | Extreme (>46 µg/m3) | Moderate, poor heating fuel use | Very Low |
| 3 | India | Hazardous (>50 µg/m3) | High river/groundwater contamination | Extremely Low |
| 2 | Pakistan | Hazardous (>73 µg/m3) | Significant sanitation deficits | Extremely Low |
| 1 | Bangladesh | Severe/Hazardous (>78 µg/m3) | Significant water/waste issues | Extremely Low |
Data ranges are approximate and based on the latest available global reports.
15. Bahrain

Key Issue: Air Quality and Industrial Contaminants
Data Point: Experiences high levels of PM2.5, affected by regional industrial emissions and naturally occurring sand and dust.
Drivers: Heavy industry, petrochemical operations, and regional air pollution transport.
As a rapidly developing Gulf state, Bahrain’s air quality is challenged by significant industrial activities, particularly in petrochemicals and heavy manufacturing. These emissions, combined with frequent, naturally occurring sand and dust storms that sweep across the region, create persistently high levels of PM2.5 particulate matter. The focus is often on managing the industrial output while simultaneously dealing with transboundary air pollution.
14. Kuwait

Key Issue: Oil Industry Pollution and Water Stress
Data Point: Significant environmental damage from the oil industry and high levels of regional dust and PM2.5.
Drivers: Oil and gas production/flaring, extremely high per-capita energy consumption, and reliance on desalination.
Kuwait faces a dual environmental challenge. Firstly, the large-scale operations of its oil and gas industry, including flaring, contribute heavily to air and land pollution. Secondly, it is a nation under extreme water stress, making it highly dependent on energy-intensive desalination for drinking water. This reliance drives high per-capita energy use, which in turn fuels more pollution, placing it high among the Dirtiest Countries in the World for environmental impact per person.
13. Cameroon

Key Issue: Air Pollution and Urban Waste
Data Point: Elevated PM2.5 levels in major cities, reflecting fast, unplanned urbanization and poor waste infrastructure.
Drivers: Vehicular emissions, lack of proper waste disposal, and reliance on biomass for household energy.
Rapid, often unplanned, growth in major cities like Douala and Yaoundé has severely strained existing infrastructure. High air pollution (PM2.5) is driven by old, poorly maintained vehicles and the widespread burning of biomass for energy. The lack of proper municipal solid waste management means that waste frequently ends up in open dumps or is burned, leading to further toxic air and water contamination.

12. Mongolia

Key Issue: Winter Smog Crisis
Data Point: The capital, Ulaanbaatar, experiences some of the world’s highest winter PM2.5 levels due to severe cold.
Drivers: Burning raw coal and biomass for heating in the traditional yurt districts (Ger areas).
Mongolia’s primary environmental crisis is a severe, recurring winter smog in its capital, Ulaanbaatar, which records some of the highest PM2.5 levels globally. This is not primarily industrial; it is driven by the necessity of burning raw coal and wood in inefficient stoves for heating by residents, particularly in the traditional “Ger” areas, to survive the extreme cold. This household pollution is a massive public health emergency every winter.
11. Qatar

Key Issue: High PM2.5 (Natural & Industrial)
Data Point: Similar to its neighbors, Qatar suffers from high PM2.5 concentrations from both natural sand/dust and rapid infrastructure development.
Drivers: Extensive construction, industrial emissions from gas production, and reliance on energy-intensive cooling systems.
Much like its Gulf neighbours, Qatar faces a mix of intense local pollution from massive construction and infrastructure projects, coupled with high background levels of natural dust and sand. The significant PM2.5 concentrations require expensive mitigation efforts. While economic wealth aids in developing infrastructure, the speed and scale of development put a major strain on air quality and resource management.
10. Democratic Republic of Congo

Key Issue: Extreme Lack of Safe Water and Sanitation
Data Point: Possesses vast freshwater resources, yet nearly 65% of the population lacks basic access to safe water, and over 80% lack basic sanitation, driving major disease risks.
Drivers: Underinvestment in water infrastructure, rapid urban growth, conflict, and institutional instability.
The DRC is a paradox: it holds over half of Africa’s freshwater reserves but is featured on this list of the Dirtiest Countries in the World due to a devastating lack of access to safe drinking water and basic sanitation. Decades of conflict, underinvestment, and institutional weakness mean that the majority of the population relies on contaminated sources, leading to high rates of waterborne diseases like cholera. This lack of hygiene infrastructure is a massive public health threat.

9. Egypt

Key Issue: Urban Air Pollution and Waste Management
Data Point: Cairo consistently ranks among the most polluted megacities globally.
Drivers: Heavy traffic (old vehicles), industrial emissions, and inefficient solid waste management, leading to widespread open burning.
Cairo’s sprawling urban area is notorious for thick smog, driven by heavily polluting vehicles and industrial activity. A persistent problem is inefficient solid waste management; open dumping and the burning of agricultural waste (the “Black Cloud” event) contribute toxic pollutants to the air and soil. Improving the collection and safe disposal of municipal waste is a huge public health priority.
8. Nepal

Key Issue: Valley-Trapped Air Pollution
Data Point: PM2.5 levels are dangerously high, particularly in the Kathmandu Valley, due to geographical factors that trap pollutants.
Drivers: Traffic congestion, uncontrolled brick production, open waste burning, and forest fires.
The geography of the Kathmandu Valley creates a serious air quality problem. The surrounding mountains trap emissions from vehicle exhaust, uncontrolled brick kilns, and open burning of waste. During winter temperature inversions, the pollution becomes concentrated and extremely hazardous (PM2.5 levels). This makes air quality a primary concern in why Nepal ranks among the Dirtiest Countries in the World.
7. United Arab Emirates

Key Issue: High Per Capita Emissions and Natural Dust
Data Point: Elevated PM2.5 concentrations are due to a combination of high industrial activity and high volumes of natural dust and sand.
Drivers: Massive construction projects, industrial operations, and low water availability leading to dependence on energy-intensive desalination.
The UAE’s ranking is heavily influenced by the combination of high natural dust (sandstorms) and its enormous per-capita energy consumption, driven by cooling demands, which generates significant emissions. Rapid construction and industrial output further compound the PM2.5 problem, although the nation has begun investing heavily in clean energy and sustainable development initiatives to counteract this.
6. Iraq

Key Issue: Conflict-Related Environmental Degradation and Dust Storms
Data Point: The country is highly vulnerable to climate change, with frequent, intense sand and dust storms severely worsening air quality and health.
Drivers: Decades of conflict destroying vital infrastructure, oil industry pollution, and water scarcity from upstream dams and mismanagement.
Iraq’s environmental infrastructure has been severely damaged by decades of conflict. Essential services like water treatment and sewage processing often fail, allowing raw sewage to contaminate the Tigris and Euphrates rivers. Furthermore, the country is highly vulnerable to increasing sand and dust storms, which worsen air quality to hazardous levels, severely impacting the health of its citizens.
5. Burkina Faso

Key Issue: Water Scarcity and Poor Sanitation
Data Point: A significant portion of the urban population lacks access to safe drinking water, and sanitation coverage is strained by rapid urban growth and conflict.
Drivers: Limited infrastructure investment, climate variability affecting water resources, and internal displacement due to conflict.
As one of the Dirtiest Countries in the World, Burkina Faso faces critical issues of water scarcity and poor sanitation, compounded by climate vulnerability and internal displacement due to conflict. Access to safe drinking water and basic hygiene facilities is severely limited for millions, leaving the population highly exposed to infectious and waterborne diseases.

4. Tajikistan
Key Issue: Heating Fuel, Smoke, and Aging Infrastructure
Data Point: High PM2.5 levels, driven primarily by the use of solid fuels (coal and wood) for residential heating and cooking, especially during colder months.
Drivers: Reliance on inefficient household heating/cooking methods and industrial facilities.
Air pollution, specifically high PM2.5, is the dominant factor here. This is primarily caused by the widespread use of solid fuels (poor-quality coal and wood) for cooking and heating in homes, especially in urban areas and during the long, cold winters. Aging industrial infrastructure and inadequate emissions control also contribute to poor air quality, placing significant stress on the public health system.
3. India

Key Issue: Air Pollution and Water Scarcity/Contamination
Data Point: The country’s PM2.5 average exceeds the WHO limit by over 10 times. Furthermore, many major rivers are heavily polluted, impacting safe drinking water access.
Drivers: Thermal power plants, massive vehicular traffic, construction dust, and biomass burning in rural areas.
India’s dual crisis involves both extremely high air pollution and significant water contamination. Its PM2.5 levels are globally concerning, driven by vehicular traffic, industrial activity, and the burning of crop residues. Simultaneously, many major waterways are heavily polluted by industrial effluent and untreated sewage, severely compromising the availability of safe drinking water and making this a key reason for its ranking among the Dirtiest Countries in the World.
2. Pakistan
Key Issue: Urban Smog and Industrial Waste
Data Point: Annual average PM2.5 levels are critically high, with major cities like Lahore and Karachi facing recurring, hazardous smog seasons.
Drivers: Vehicular emissions (especially diesel), industrial activity, and crop residue burning contribute to regional air quality crises.
Pakistan grapples with chronic, hazardous smog, especially in its major cities during the winter months. This environmental calamity is fuelled by unchecked vehicular emissions, heavy industry, and the seasonal burning of agricultural waste. The challenge is magnified by inadequate industrial waste control and insufficient municipal solid waste collection, contributing to an overall ranking that confirms its status as one of the Dirtiest Countries in the World.
1. Bangladesh

Key Issue: Unprecedented Air Pollution
Data Point: Consistently ranks among the highest globally for PM2.5 concentration, with an annual average often exceeding 75µg/m3 (over 15 times the WHO limit of 5µg/m3).
Drivers: Brick kilns, industrial emissions, construction dust, and transboundary smog.
Bangladesh consistently ranks as the country with the most hazardous air quality in the world, with annual PM2.5 averages routinely over 15 times the WHO guideline. The main culprits are poorly regulated industrial brick kilns, rapid, unchecked urban development, and cross-border pollution. Its high population density and low-lying geography also make it intensely vulnerable to climate change and rising sea levels, confirming its position as the Dirtiest Country in the World based on immediate environmental health risk.

What Causes Such High Pollution Levels?
The severe environmental conditions in the Dirtiest Countries in the World are rooted in a combination of rapid, unregulated development and weak infrastructure.
Air Pollution: Dominantly driven by the incomplete combustion of fossil fuels in old vehicles, the burning of biomass/coal for household cooking/heating, and industrial emissions. Transboundary pollution and seasonal crop burning further intensify hazardous PM2.5 levels, often exceeding WHO guidelines by over 10-15 times.
Water Scarcity & Contamination: A huge portion of domestic and industrial untreated sewage and chemical discharge flows directly into rivers and groundwater. This contamination severely limits access to safe drinking water, accelerating the spread of waterborne diseases.
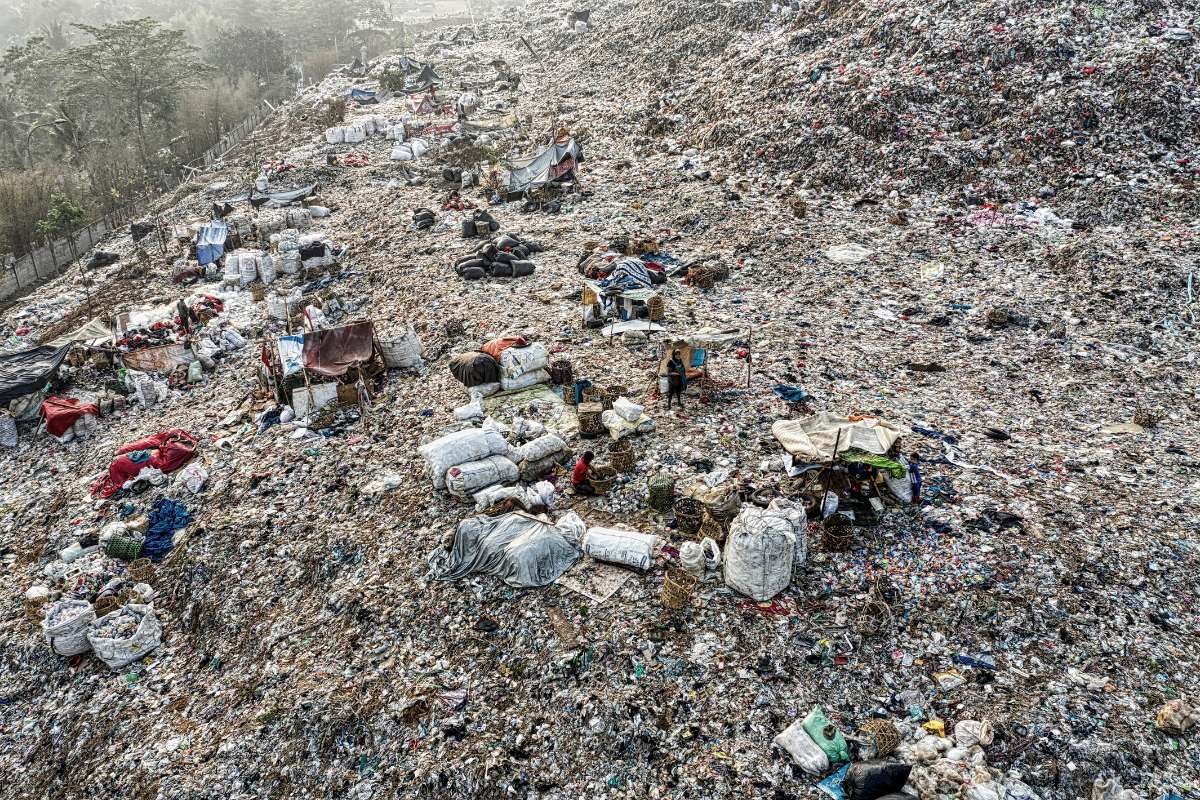
Waste Mismanagement: Rapid urbanization outpaces the ability of cities to manage solid waste. The result is the proliferation of open dumps where waste is often burned, releasing toxic fumes and methane, due to a lack of proper recycling and treatment facilities.
Real World Impact: Health, Economy, and Daily Life:
The dirtiest countries in the world have environmental crises. They can have disastrous effects on people and the economy.
Millions of premature deaths are caused by pollution each year, and exposure to PM2.5. It results in heart problems, respiratory disorders, and shorter lifespans. Crucially, only a small number of nations. It is roughly seven according to recent reports that meet the strict WHO standards for air quality.
The economic cost of air pollution is huge. It costs the world economy trillions of dollars annually. In India alone, healthcare costs and decreased worker productivity are estimated to have cost 3% of GDP in 2019. Beyond the money, the lack of access to clean water. This is a daily struggle in many of these countries. It immediately lowers the quality of life and turns basic survival into a continuous health risk.
What the Dirtiest Countries Are Doing? (Initiatives and Solution)
The nations included in the list of Dirtiest Countries in the World. They are taking crucial steps toward mitigation. This is often driven by severe public health pressure and international partnerships.
- Policy Changes: Governments in South Asia (like India and Pakistan). They are implementing stricter vehicle emissions standards and incentivizing the industry. This helps to shift from coal to cleaner gaseous fuels. For example, the Haryana state in India is collaborating with the World Bank on a multi-crore Clean Air Project. It focuses on industrial and transport upgrades.
- Waste Reduction Programs: Focus is increasing on integrated solid waste management to end toxic open burning. In parts of Africa, there is a push for decentralized waste collection and recycling models. This is often supported by social enterprises.
- International Partnerships: Global initiatives like the Sanitation and Water for All (SWA) partnership. Along with the World Bank’s clean air funds. They are providing vital technical and financial support. These partnerships help African nations like Burkina Faso accelerate progress. And meet Sustainable Development Goals (SDGs) for clean water and sanitation.
Comparison: Dirtiest vs Cleanest Countries
This comparison provides context by contrasting the environmental challenges faced by the Dirtiest Countries in the World. With the best practices of cleaner, highly-ranked nations.
| Category | Top 3 Dirtiest Countries (e.g., Bangladesh, Pakistan, India) | Top 3 Cleanest Countries (e.g., Estonia, Finland, Germany) |
| Air Quality (PM2.5) | Hazardous (>50 µg/m3) — Exceeds WHO guidelines by 10x to 15x. | Pristine (<5 µg/m3) — Meets or exceeds WHO guidelines due to low emissions. |
| Water & Sanitation | Critical Deficits— High levels of contamination from industrial and untreated sewage discharge. | Near Universal Access— 100% safely managed drinking water and robust wastewater treatment systems. |
| Key Drivers | Reliance on solid fuels (coal/biomass), rapid urbanization, and weak environmental enforcement. | Stringent environmental laws, high investment in renewable energy (wind, bioenergy), and efficient recycling. |
| Health Impact | Shortened lifespan, high rates of respiratory and waterborne diseases. | Excellent public health outcomes are directly linked to a clean environment. |
Conclusion:
The information makes it clearly evident that the problem is in the dirtiest countries in the world. They are broad and go well beyond local air quality measurements. The real problem is the combined problems of the water, sanitation, and air systems. These have a significant negative impact on public health and the economy. Even though there are initiatives in place to meet global environmental and health standards. Such as enforcing stricter emissions regulations and obtaining international funding for clean water. There is still a long way to go. The environmental realities of these countries can only be changed, and the daily health risks that billions of people face reduced. With the help of consistent investment and strong governance.
FAQ:
1. Is air pollution the only factor used to rank the dirtiest countries in the world?
No. While air pollution is a major factor, especially PM2.5 exposure. It is not the only metric. Most credible rankings also consider unsafe drinking water, poor waste disposal, lack of sanitation, and industrial pollution. This makes the assessment more holistic and accurate.
2. Why are developing countries more common on lists of the dirtiest countries in the world?
Developing countries often face rapid urbanization, population growth, and weak environmental regulations. Along with limited waste infrastructure and reliance on fossil fuels. These factors make pollution control more difficult. Even though many of these nations contribute far less historically to global emissions.
3. Are the dirtiest countries in the world doing anything to reduce pollution?
Yes. Many countries are actively working on clean energy transitions. With vehicle emission regulations, plastic bans, improved waste systems, and international environmental partnerships. While progress is uneven. Several nations have shown measurable improvement in specific cities and sectors.