Due to the rising fame of digital currency, it is crucial to learn all the trading tools. Why is it so? It will encourage traders to make the right decision at the right time.
Here, in this article, along with safetradebinaryoptions.com, we are rationalizing the trading volume indicators. These tools are helpful to be part of this ecosystem.
Let us jump onto the trading bandwagon!
Relative Volume Indicator:
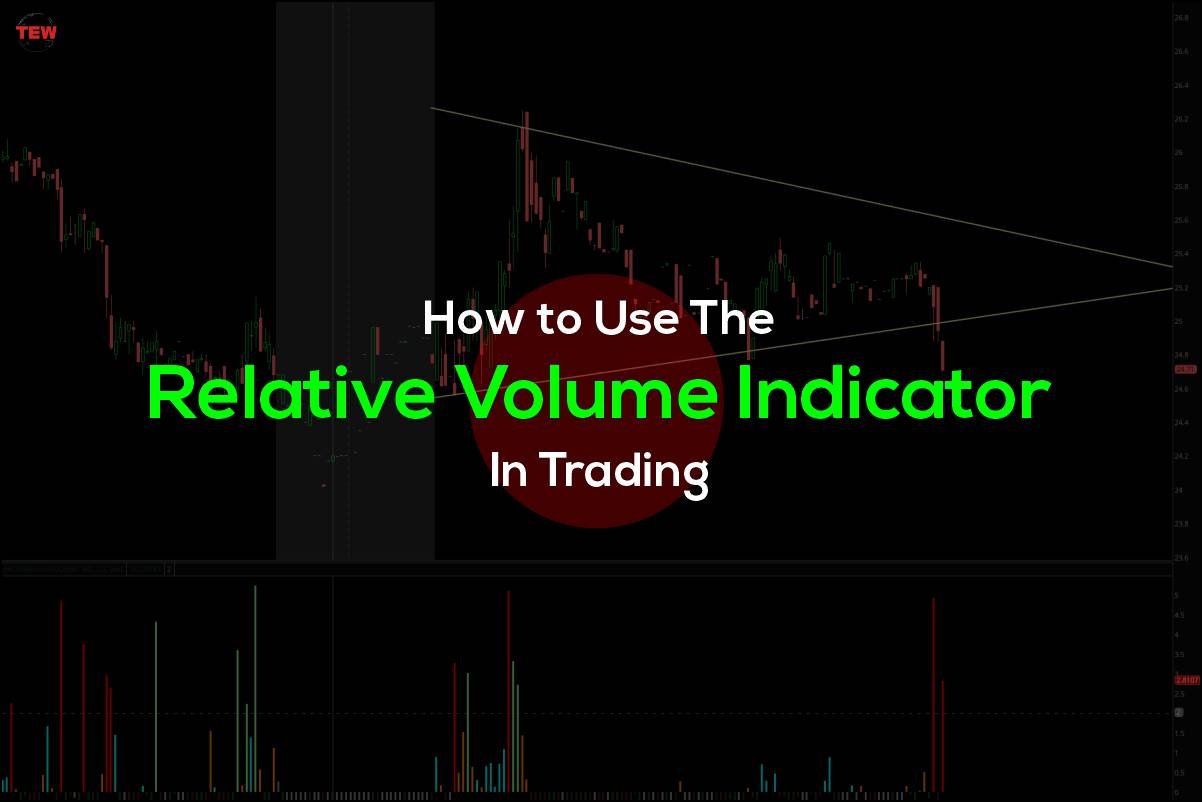
The Relative Volume Indicator (RVOL) elaborates how the trader can perform a trading volume analysis. This analysis is a comparison of current and previous binary trading volume within a time frame.
What does volume stand for?
Volume means the number of shares of a firm that they buy or sell in the market within a day. Suppose someone sells 50 million shares in the market. It shows the liquidity of stocks.
In short, Relative Volume Indicator informs how operational a stock is. The more the ratio, the more active the product and the more traders have eyes on it.
Calculation Method of RVOL:
We can calculate the relative volume in terms of ratio. The formula for the trading volume ratio is straightforward.
The formula for Relative Volume Indicator:
Current volume / Average Volume
Example No.1: Apple Incorporation
Let us take the example of Apple Incorporation (NASDAQ: AAPL). Suppose we have a 6-month average measuring period. The daily volume for the 6-month average is 0.5 Million. Now, the current volume of NASDAQ: AAPL is 5 Million.
How to evaluate the ratio?
Current Volume / Average Volume
= 5 Million / 0.5 Million
= 5x
This ratio explains that Apple Incorporation has 5x times more trade today in contrast to the last 6-month average daily volume.
Example No.2: Russell 2000 Index
Let us take the instance of the Russell 2000 Index (INDEXRUSSELL: RUT). Suppose we have a five-day average measuring period. The daily volume for the five days average is 0.2 Million. Now, today’s trading volume is 5 Million.
How to evaluate the ratio?
Current Volume / Average Volume
= 5 Million / 0.2 Million
= 2.5x
This ratio explains that the Russell 2000 Index has 2.5x times more trade today when compared to the last 5-day’s average daily volume.
Implementation of RVOL in Trading:
When trading the market, it is advantageous to employ the volume indicator as a trader. Using the information offered in premarket trading is the simplest way to do this.
To understand this, we assume an example of top movers and their volume in premarket trading. As per the premarket screeners, LM Funding America is at the top gainers. Their trading volume of the stock has increased to 8.76 Million. Whereas, Siyata Mobile Inc. is at the top losers as their trading volume reduced to 0.20K.
It means that the volume is the support system for the stock jump. As a trader, you need to have your eyeballs on the news of the day. It will help you to understand the reason why these changes take place.
Analyze The Relative Volume Indicator With Other Strategies:
Most of the time, using the Relative Volume Indicator alone leads to disappointing results. Therefore, in this regard, using the Relative Volume Indicator in contrast to other indicators is more favorable. It will ease the decision-making process to identify which stock is more active and operational and should buy and sell.
Example:
Assume the example of Mesoblast, in which we can see that the stock slammed around the 78.6% Fibonacci retracement level and then endeavored to bounce back.
Owing to the above, we can predict that, in the future, we can focus on the two main strategies. The stock may first try to close the void, or it may try to plunge below the retracement level.
Bottom Line:
All you need to be able to utilize this indicator is the “focus.” There is no requirement for an expert mathematician to analyze the trading volume as anyone can do it. One must be able to read the facts. To get a clear picture of the stocks that are at the top.
So, practice trading along with other financial tools to be called the master of digital trading.
That’s all! If you find this piece of article interesting, do share your views in the comment section below.


