

The most resilient organizations share a simple secret: they treat their team’s feedback as their single most valuable growth asset.
When leadership actively listens and adapts to what employees need, trust deepens, and enthusiasm across every department grows exponentially.
That ongoing conversation relies on tracking regular employee engagement metrics. By following real-time signals like participation rates, team satisfaction scores, and retention trends, management gains clear, practical insight into how supported and connected their workforce feels every day.
In this article, we will see how turning employee voices into actionable improvements creates an open, collaborative environment. An environment where top talent naturally wants to build long-term careers.
What Are The Core Employee Engagement Metrics to Track?
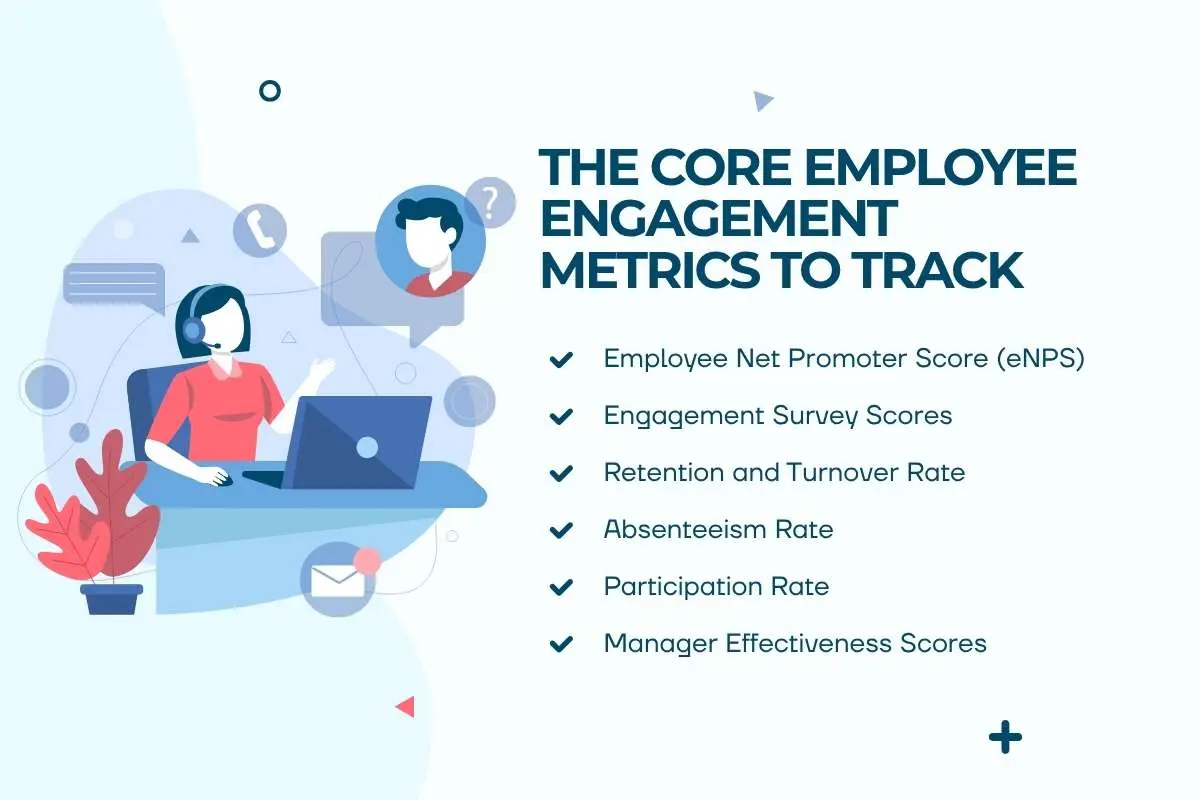
Engagement metrics show how people feel at work. They also show how employees behave over time. These measures help leaders spot problems early. They can also show whether new workplace efforts are working.
One metric cannot tell the whole story. Leaders need several measures for a clearer view. Some metrics track employee sentiment. Others show actions, workplace habits, and management quality.
1. Employee Net Promoter Score (eNPS)
eNPS measures employee sentiment toward the company. It asks how likely employees are to recommend the workplace to others. Employees give a score from 0 to 10. Scores of 9 or 10 count as promoters, while scores from 0 to 6 count as detractors.
The company subtracts the detractor rate from the promoter rate. A higher score can show stronger employee sentiment. A lower score may point to frustration or low trust. Employee comments can explain what sits behind the score.
2. Engagement Survey Scores
Engagement surveys give employees a way to share their views. These surveys can cover recognition, leadership, communication, growth, workload, and culture. Leaders should first review the overall engagement score. They should then check each driver on its own.
This approach can uncover issues hidden by the overall score. Employees may feel good about their teams but see few growth options. That gap can guide better employee engagement strategies. Tracking the same areas over time also shows whether changes are helping.
3. Retention and Turnover Rate
Retention shows how many employees stay with a company. Turnover shows how many employees leave during a set period. Both measures help leaders understand workforce stability. They can also point to problems within the employee experience.
High turnover can have many causes. Poor management, limited growth, heavy workloads, and low engagement can all lead to exits. Leaders should use employee retention strategies to separate voluntary and involuntary turnover. Exit interviews can also reveal why employees choose to leave.
4. Absenteeism Rate
Absenteeism measures missed workdays over a set period. Frequent unplanned absences can signal workplace concerns. Stress, low morale, and heavy workloads may affect attendance. A sudden rise can also point to problems within a specific team.
Still, absence does not always mean disengagement. Personal needs can affect attendance as well. Leaders should compare absenteeism with other engagement measures. This gives them a more balanced view of what may be happening.
5. Participation Rate
Participation rate measures how many employees join workplace activities. Companies can track surveys, recognition programs, training, and company events. High participation often shows that employees are willing to get involved. Low participation can signal weak communication or limited interest.
The reason behind the number matters too. Heavy workloads may stop employees from joining an event. Poor timing can create the same problem. Leaders should compare participation data with employee feedback before making changes.
6. Manager Effectiveness Scores
The most memorable recognition comes most often from an employee’s manager (28%)
Managers have a direct effect on daily employee experiences. Their actions shape communication, feedback, support, and recognition. Manager effectiveness scores show how employees view their managers. Surveys can ask if managers listen, support growth, and give useful feedback.
Leaders should compare these scores across teams. Strong scores can reveal management practices worth sharing. Low scores can show where managers need more support. Training can then target the areas that employees mention most often.
Bringing the Metrics Together
These employee engagement metrics give leaders a different view of engagement. eNPS shows employee sentiment, while retention and turnover show workforce movement. Absenteeism highlights attendance patterns. Survey scores reveal the workplace factors that affect employees.
Manager scores add another useful layer. They show how employees experience leadership each day. Leaders should look at these metrics together. When several measures move in the same direction, they can reveal a deeper engagement issue.
How Often to Measure Employee Engagement?
Annual surveys alone can leave important gaps. Employee needs and workplace experiences can change within a few months. A yearly survey may miss these shifts. Many teams now use shorter pulse surveys to gather feedback more often.
A quarterly pulse survey offers a good balance for many teams. These surveys can focus on workload, recognition, support, or morale. A deeper annual survey can then provide a wider view of employee engagement.
The right schedule depends on the team. A mix of pulse surveys and annual reviews can provide useful data without overwhelming employees.
Building a Simple Employee Engagement Metrics Dashboard
A good employee engagement dashboard makes data easier to understand. It should not overwhelm managers with too many numbers. Follow these steps to build a simple dashboard that supports better decisions.
Step 1: Choose Your Core Metrics
Start with a small group of useful metrics. Include measures such as eNPS, survey scores, turnover, absenteeism, participation, and manager effectiveness. Choose the employee engagement metrics that match your goals and workplace needs.
Avoid adding every available measure. Too much data can make the dashboard hard to read. Start with the metrics that give the clearest view of engagement.
Step 2: Segment the Data
Look beyond company-wide results. Break the data down by team, manager, location, or other useful groups. This can show where engagement gaps actually exist.
A strong company-wide score can hide problems within one team. Segmented data helps leaders find these differences faster. It also makes it easier to target the right teams with the right action plan.
Step 3: Set a Review Schedule
Use different review periods for different levels of analysis. Take a quick look at key metrics each week or month. This helps managers spot sudden changes before they grow.
Set aside time each quarter for deeper analysis. Compare trends, review employee feedback, and look for patterns across teams. This keeps the dashboard useful without making every change seem urgent.
Step 4: Turn Findings Into Action
A dashboard should support decisions, not just display numbers. Start by identifying the biggest gaps or sudden changes. Then connect each issue to a clear action that leaders can take.
Track the same metrics after making those changes. Compare the new results with earlier data to see what improved. If a metric stays weak, review the cause and adjust the action. This turns the dashboard into a tool for continuous improvement.
Common Mistakes to Avoid When Tracking Employee Engagement Metrics

Employee engagement data only helps when managers act on it. Poor tracking can hide problems and make useful feedback harder to use. Avoiding common measurement mistakes can make engagement data more useful.
1. Tracking Metrics Without Clear Ownership
Collecting engagement data is only the first step. Someone must review the results and decide what happens next. Without a clear owner, teams may collect feedback but fail to act on it. This can also make employees feel that their feedback does not matter.
How to improve: Assign each metric to a specific leader or team. Set a review date and agree on the next action before collecting the data. This creates clear accountability and keeps follow-up work on track.
2. Relying on One Blended Score
A single engagement score can hide important problems. A team may have a strong overall score but still struggle with recognition, leadership, workload, or career growth. A blended number cannot show which areas need attention.
How to improve: Break results down by key employee engagement drivers. Review areas such as management, recognition, growth, workload, and communication. This gives leaders clearer insights and helps them target the right issues. As Special Advisor Jeffrey Sanow puts it:
“The true challenge lies in knowing what must remain confidential while communicating openly enough to build genuine confidence among colleagues and decision-makers.”
3. Measuring Employee Engagement Metrics Too Infrequently
Annual surveys can leave leaders with long gaps between feedback points. Problems may grow during that time without anyone noticing. Employee sentiment can also shift after changes in leadership, workload, policies, or company structure.
How to improve: Add short pulse surveys between annual reviews. Monthly or quarterly checks can help leaders spot changes earlier. Keep these surveys focused and brief to reduce survey fatigue.
Conclusion:
Highly engaged businesses are 21% more profitable than those without an engaged workforce. And to track whether your employees are engaged, you need to make use of the right metrics.
Relying on quarterly revenue alone leaves managers blind to the daily health of their teams. Consistently analyzing employee engagement metrics transforms company culture from a vague, abstract goal into a manageable driver of business performance. As Founder and Consultant Christine Riley VanDerVort says:
“Culture is not a statement on a wall. It is what people experience every day.”
FAQs
1. What are employee engagement metrics?
They are the quantitative data points like survey scores, turnover rates, and feedback participation. They are used to measure how connected employees feel at work.
2. Which engagement metrics matter most for leadership teams?
Focus on Employee Net Promoter Score (eNPS), voluntary turnover rates, pulse survey sentiment, and internal promotion rates to get an accurate picture of organizational health.
3. How frequently should a company collect engagement data?
While comprehensive surveys are useful annually, running brief monthly pulse surveys provides the real-time feedback necessary to catch emerging issues early.
4. How does employee engagement differ from employee retention?
Retention simply measures who stays on the payroll, whereas engagement measures how enthusiastic, committed, and productive those employees are while doing their work.
5. What is the best way to respond to negative engagement data?
Share the results transparently with your team, outline clear steps to fix the highlighted problems, and follow through on those commitments publicly.
Sources and references: