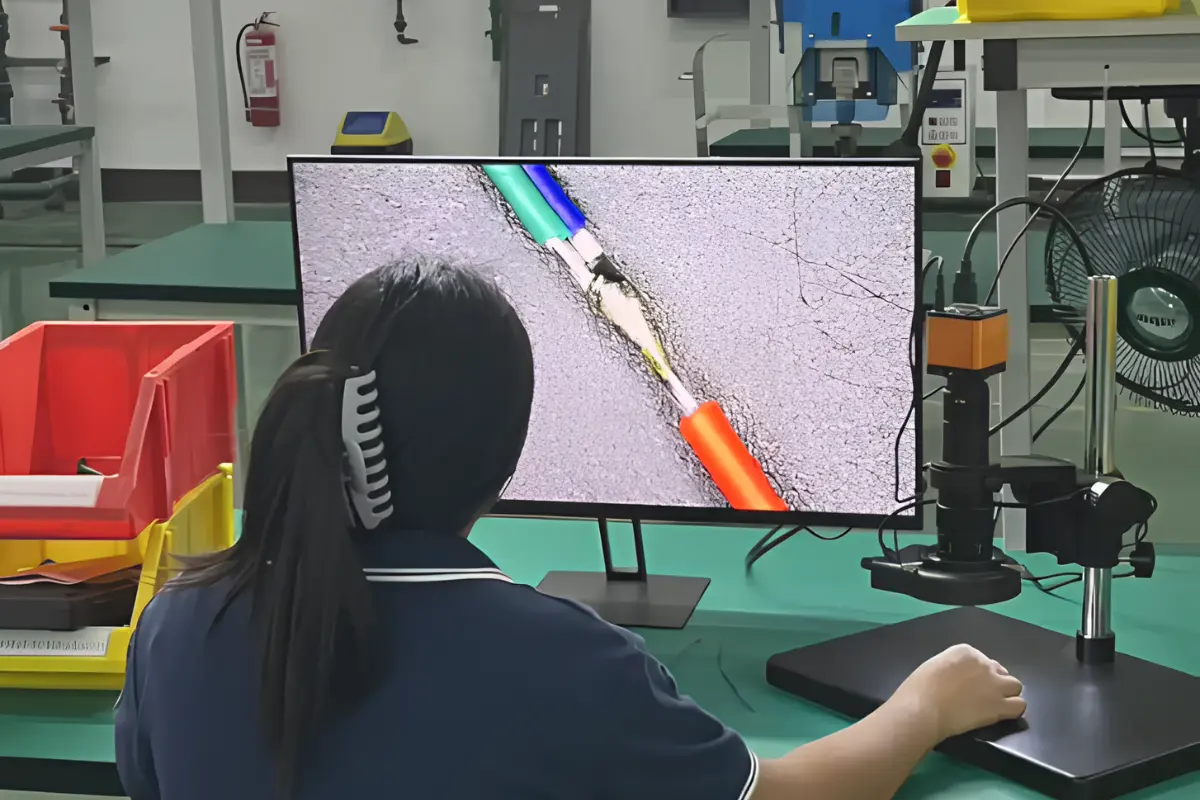

A factory can have machines, sensors, dashboards, and enough production data to fill a small library, yet still struggle to answer one simple question: Are we actually getting better?
That is where smart manufacturing metrics earn their keep. The goal is not to collect every number a machine can produce. It is to connect the right measurements to real production problems and decisions. OEE can show how effectively equipment is performing, while downtime, throughput, cycle time, and quality reveal where losses are hiding.
Maintenance metrics can expose recurring issues, and efficiency gains can show whether a change actually paid off. After all, 500 dashboards do not mean 500 useful answers.
What are smart manufacturing metrics and why do they matter?
Smart manufacturing metrics are measurable indicators that show how well a factory’s machines, processes, and people are performing. They turn raw production data into signals that teams can use to spot losses, compare results, and make better decisions.
But there is a difference between having data and having a useful metric. A machine might record temperature every second. That is data. Tracking how temperature changes when defects increase can become a useful performance measure.
| Data point | Performance metric |
| Machine temperature | Temperature linked to defect rates |
| Machine run time | Equipment availability |
| Units produced | Throughput per hour |
The best metrics answer a clear question. Are machines losing too much time? Is output improving? Are defects rising? Is production costing more than it should?
That is also why smart manufacturing should not mean measuring everything simply because your software can. If a number does not help you understand cost, output, quality, downtime, or delivery, it may not deserve a spot on the dashboard.
Which metrics should a manufacturer track first?
There is no prize for having the longest factory dashboard. Start with the numbers that help you understand where the biggest losses are happening. The right smart manufacturing metrics depend on what is holding your operation back.
| Metric | What it tells you |
| OEE | How effectively equipment is being used |
| Downtime | Where production time is being lost |
| Throughput | How much useful output is produced |
| Cycle time | How quickly a process completes |
| First-pass yield | How much output meets quality requirements first time |
| Energy per unit | How efficiently resources are being used |
If equipment keeps stopping, downtime and OEE deserve attention first. If orders are falling behind, throughput and cycle time may tell you more. If scrap is eating into margins, first-pass yield becomes harder to ignore.
This is also where smart manufacturing tools can help. They make it easier to collect, organise, and compare production data without forcing teams to dig through spreadsheets every time they want an answer.
A good starting rule is simple: measure the problem before measuring everything else. Once those numbers reveal a clear pattern, you can add more detail without turning the dashboard into a digital junk drawer.
How to measure OEE without making it more complicated than it needs to be

OEE, or Overall Equipment Effectiveness, shows how effectively a machine is being used during planned production time. The basic formula is:
OEE = Availability × Performance × Quality
Here is what each part means:
- Availability: How much planned production time the equipment was actually running. Breakdowns, long setups, and other stops can bring this number down.
- Performance: Whether the equipment runs at its expected speed. A machine can be running continuously and still fall short if it is operating slower than its ideal cycle time.
- Quality: How much of the output is good product rather than scrap or rework.
Together, these three factors give manufacturers a clearer picture of where equipment is losing effectiveness. That makes OEE one of the more useful smart manufacturing metrics to track.
As a reference point, an often-cited world-class OEE benchmark is 85%, based on 90% availability, 95% performance, and 99% quality. However, this should not become a universal target. Vorne recommends using incremental targets based on your own baseline and process rather than chasing a single benchmark.
But OEE is not a magic score. A low result tells you that something needs attention. The real value comes from checking which part is dragging the score down.
For example:
Low availability → investigate stoppages
Low performance → investigate slow cycles
Low quality → investigate defects and rework
If you want to go deeper into the production side of measurement, smart manufacturing process provides useful context for understanding how these improvements fit into daily operations.
The goal is not simply to chase a higher OEE percentage. It is to find the loss behind the number and fix it.
Why downtime deserves its own metric
A machine being down is easy to notice. Understanding why it keeps going down is where things get interesting.
Start by separating:
- Planned downtime: Scheduled stops for maintenance, changeovers, cleaning, or other planned work.
- Unplanned downtime: Unexpected breakdowns, faults, material issues, or other interruptions.
Then look beyond the total time lost. How often does a machine stop? How long does each stop last? And are the same causes showing up again and again?
For example, ten five-minute stoppages and one 50-minute breakdown both add up to 50 minutes of downtime. They are not the same problem. Frequent short stops may point to a process or equipment issue, while a long breakdown may require a different maintenance response.
The scale of the problem can be significant. IBM cites APQC research showing that unplanned downtime can account for up to 6% of scheduled run-time in industrial companies.
Two useful supporting measures are mean time between failures (MTBF) and mean time to repair (MTTR). MTBF shows how often failures occur, while MTTR shows how quickly equipment is restored.
This is why the task of reducing downtime with smart manufacturing deserves attention alongside other smart manufacturing metrics. The number matters, but the pattern behind it matters more.
How do you know if efficiency gains are actually real?

A better number on the dashboard does not automatically mean the factory got better. To prove an improvement, compare performance before and after the change, while keeping an eye on what else moved.
Start with a clear baseline. Then compare the same measures after the change:
- Production volume
- Output per hour
- Quality and scrap
- Labour or energy used
- Downtime
- Overall operating conditions
For example, imagine a production line moving from 80 to 88 good units per hour.
Before: 80 good units/hour
After: 88 good units/hour
Change: 10% more good output per hour
That looks like a win. But what if scrap also increased, energy use jumped, or downtime became worse? The headline number suddenly looks a lot less impressive.
This is where smart manufacturing ROI becomes useful. The goal is to connect smart manufacturing metrics to a real business outcome, not simply celebrate a higher percentage.
A genuine efficiency gain should show that the operation is producing more useful output, wasting fewer resources, or reducing losses without creating a new problem somewhere else. Otherwise, you may just be moving the factory’s headache from one dashboard to another.
Quality metrics stop efficiency from becoming a false win
Faster production is not always better production. If output rises while defects rise with it, the factory may simply be making bad parts faster.
A few quality measures help keep that in check:
- First-pass yield: The share of products that meet requirements without rework.
- Scrap rate: How much material or output is rejected.
- Rework: Products that need additional work before they can pass inspection.
- Defect rate: How often production results in defects.
- Customer returns: A useful downstream signal when defects make it to the customer.
Quality problems can also be harder to translate into business impact than production losses. ASQE’s 2025 Cost of Quality report found that only 31% of respondents said they fully understood how quality costs affect their organization’s financial performance.
For example, a line that produces 10% more units but creates 15% more scrap has not necessarily become more efficient. Looking at output alone would miss the problem.
That is why quality needs to be measured alongside production performance. Smart manufacturing metrics only tell the full story when teams look at useful output, defects, scrap, and rework together. A useful unit is worth more than a merely completed one.
The best smart manufacturing metrics lead to action
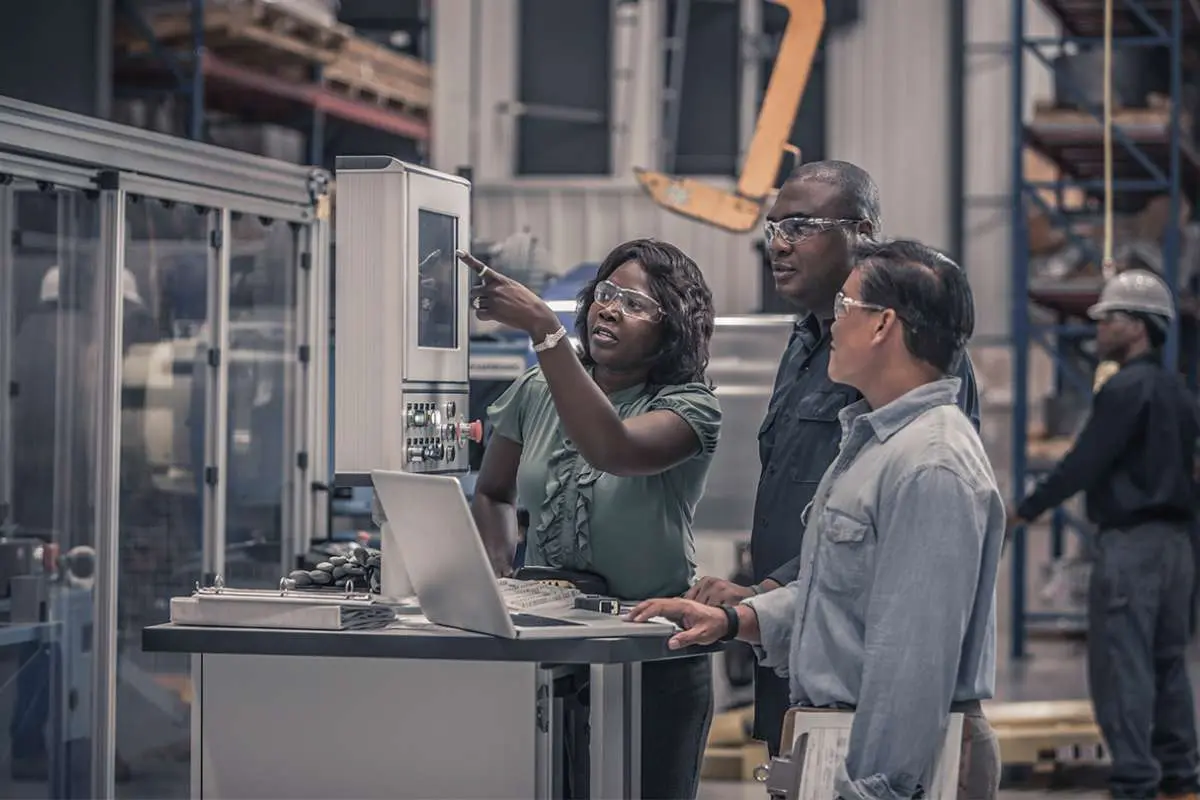
A metric is only useful if it helps someone decide what to do next. Otherwise, it is just another number quietly taking up space on a dashboard.
A useful way to think about it is:
Metric → Problem → Root cause → Action → Result
For example:
- Rising downtime → Investigate recurring machine faults.
- Falling first-pass yield → Look for process variation.
- Longer cycle time → Check bottlenecks or machine performance.
- Higher energy per unit → Investigate inefficient equipment or operating conditions.
This is where smart manufacturing metrics become more valuable. With manufacturing data analytics, teams can move beyond spotting that a number changed and start looking for the reason behind it.
The goal is not to produce a weekly report full of impressive-looking charts. It is to spot a problem early, find its cause, take action, and then measure whether that action worked.
In other words, the metric is not the finish line. It is the starting point for a better decision.
Conclusion: Measure less, understand more
You do not need dozens of metrics to know whether a factory is improving. Start with the measures closest to the problem. Use OEE to understand equipment effectiveness, downtime to find lost production time, quality metrics to track usable output, and efficiency measures to see whether a change actually delivered better results.
The real value of smart manufacturing metrics comes from what happens after the number appears. If a metric reveals a problem, investigate it. If you make a change, measure the result. If the result improves, understand why.
That is the point of smart manufacturing better information leading to better decisions, not simply more numbers on a screen.
FAQ
1. How often should smart manufacturing metrics be reviewed?
Review critical metrics daily or by shift, then analyze longer-term trends weekly or monthly.
2. Who should be responsible for tracking manufacturing metrics?
Assign ownership to teams closest to each process, with managers responsible for reviewing trends and addressing major issues.
3. Can manufacturers track too many metrics?
Yes. Too many metrics can hide important signals and make it harder to identify priorities.
4. What makes a manufacturing metric actionable?
An actionable metric connects to a specific process, has a clear target, and supports a practical decision.
5. Should manufacturers use the same metrics across every production line?
Not always. Core metrics can stay consistent, while individual lines may need measures suited to their processes and goals.